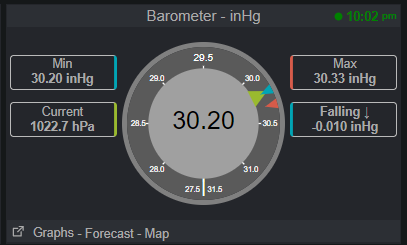
Tom, not sure what the difference is between our sites, but mine indicates if the barometer is rising or falling. Are you running the latest version of the scripts?
PWS_module_test.php => Left second button lists the contents of the weather file.
This is all the data the ecowitt console/GW1000 can deliver for the pressure/barometer:
     [baromrelin] => 30.171
    [baromabsin] => 29.400
Yes you can add a lot of sensors, but the data from the station contains realtime values only.
The PWS_Dashboard can only show the values from the station, and daily high-lows if you are running a cron-job.
With a weather-program you can also get trend values a.s.o.
F.i. WeatherDisplay will digest these primary data and calculate all kind of calculated data such as Pressure-trend.
A weather program does its work 24/7 continually and is IMHO more then worth the money you paid for.
Thank you for the answer. I did not realize that there was that much difference. I came from the old W34 template and it had the trend in it as well as the ‘new’ Aurora template.
I do realize they both are vastly different from this template, and in my particular case are not using the GW1000 itself as the data source (which I like very much). This is the first template that I have used without a comparison between current and recent historical values.
I just looked and saw the data is stored in a .txt file which would make any calculations difficult unless there were historical value ‘variables’ used in the script itself. Even then it would be programming nightmare.
Its not that hard to check the graph, so I am ok with it.
Sorry to bother. Great template. I do not think I have any other issues.
I am confused what you are referring to.
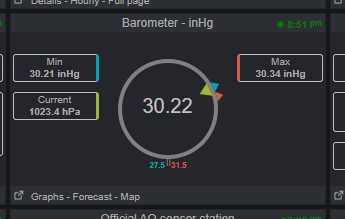
There is a complete “comparison between current and recent historical”
All daily high-low values are there. Even all historical values.
The temp block shows current, high and low temp. Same for the baro block.
Those are calculated by the cron-jobs.
But IMHO some values such as windrun or trends can not be calculated with an "every 5 minute" calculation.
I just looked and saw the data is stored in a .txt file which would make any calculations difficult unless there were historical value 'variables' used in the script itself.
The historical data uses date/time and float values and are stored in a php-array
==> which is then saved as a text-file on the server.
Use the debug-dashboard and you can see check all values.
Or check directly with http://wd.meckweather.com/PWS_listfile.php?file=_my_settings/history.txt&type=arr
Even then it would be programming nightmare.
Its not that hard to check the graph, so I am ok with it.
Sorry to bother. Great template. I do not think I have any other issues.
Tom
A trend is not an easy calculation. One can not do a simply compare current with "so many" hours ago
As temp gets higher and lower multiple times / day.
Even pressure fluctuates between higher - lower - higher during the day with passing rain a.s.o.
So one has to compare average of "X measurements last YY minutes" with the "X measurements previous YY minutes"
A weather-program is comparing and calculating the trend with every received measurement.
Impossible to do if you are only "awake" every 5 minutes and you only process the last measurement received.
I give this extensive answer as it is an interesting topic and having historical values and trends is a question which arises often.
Next time a user should find this discussion with a search on the forum
Wim
P.S. Similar “discussion” as we have had with Air-quality were we receive real-time values, but the health conditionds are based on 24-hour values. Took a long time and some trial and error coding for the “Luftdaten” scripts to get it right.