. . . almost ![]()
. . . almost ![]()
I generated the graphs data-files, please unzip attached folder and put the contents in your chartsmydata/ folder
The files contains all available data from the .CSV Most of the missing data could be loaded from the new WU-database, but not all. 2 days are still missing.
As with other users, your new WU-dashboard is missing more days for July
then in the .CSV.
https://www.wunderground.com/weatherstation/WXDailyHistory.asp?ID=KMDBELCA3&graphspan=day&day&month&year&format=1
Lets hope that WU will get all data in at least one of the databases correct.
Wim
chartsmydata.zip (12.3 KB)
Posted an updated zip in Reply #278
Wim
Thanks, Wim ![]()
I attach a “release ready version” of the convert script for users of the July version
I could test the .CSV files from about 5 users, but sadly only for 3 weather-programs. Maybe there are bugs left.
Unzip and place the script in your pwsWD/ folder
Execute the script with Fastest Web Hosting Services | Buy High Quality Hosting
This readme explains how the script works: https://pwsdashboard.com/readme_convert_wu.pdf
After converting your wuID.CSV file, the website files can be used for your graphs.
They are at least as complete as the combined WU data from the .CSV and your WU dashboard.
Change the easyweather setting for which graph-files you use.
Do not forget to activate the w34_cron_addtoyear.php which should run before the end of each day.
You can check the documentation at https://pwsdashboard.com/documentation/WD34_cron-2019-07.pdf
Sorry, there was already 1 download but I had to upload a new and corrected version at Aug 25, 17:40 UTC
Wim
cvt_wu_script.zip (19.1 KB)
@Wim
for me it seems to me that RAIN graphs are corrupt? no ?
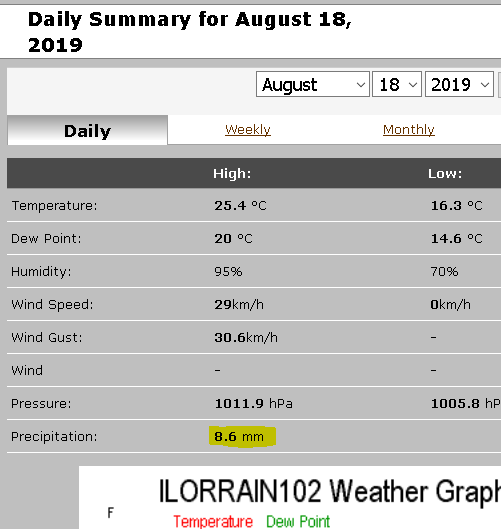
example: rain / month dated 18.08: charts_graphs = 86.36mm while value recorded by the station was 8.6mm
it is this value that gives me for example the execution of the last script “WUhistory” of Sratoga
ps./
for ID = ilorrain49 same inconsistency
charts_graph for 18.08 = 99.06 mm vs./ good recorded value = 9.9mm #-o #-o
Best Regards
I found the reason. FYI the API returns metric in mm, the CSV is in cm.
So all rain values are 10 times higher then they should be. :oops: :oops:
Attached the correct data.
Wim
@ALL: I updated the zip which is two post back
chartsmydataILORRAIN49.zip (12.2 KB)
chartsmydataILORRAIN102.zip (13 KB)
Thanks Wim! Worked like a charm!
@Wim thank you very much … very strange for iLORRAIN102 it is ok for against for iLORRAIN49 despite the file download the “RAIN/rmonth” charts have remained unchanged … :oops: #-o
I also downloaded and run the updated _cvt_wucsv.php
But rainfall after July 25 still appears 10 times too high.
Another mystification:
After July 25, winds and gusts will be shown with the same value, except for August 13.
oops i did not notice but actually at home too :o :o
IMPORTANT
You have to remove the backup file if you run the script twice. Otherwise the data generated in the last run is not replaced.
The backup file is stored in chartsmydata/_wuid_Y.txt in your case "weather.inaogmogens.dk"
Everytime the cvt-script runs it checks if there is an already updated file in chartsmydata/ and it uses that.
So if you want to start from scratch remove that file from chartsmydata/
===
Iran the script with your ID and it works OK
When there is only one line for wind it is the previous version which also had the rain 10* as big.
Attached: the correct files for IDKFREDE2
Wim
Update 8:55 UTC:
I just downloaded the zip and the script from the zip is correct, identical as I use at home
Compared it with "weather.inaogmogens.dk" identical
So the script probably has run with an already updated backup file
README step 1.1 https://pwsdashboard.com/readme_convert_wu.pdf
chartsmydataIDKFREDE2.zip (12.4 KB)
Check if you have the latest version, remove the iLORRAIN49Y.txt from the chartsmydata/ folder and rerun the script.
See previous post.
Wim
new update, ok worked well on some problems with the old compiler ![]()
thanks for the help !
Regards
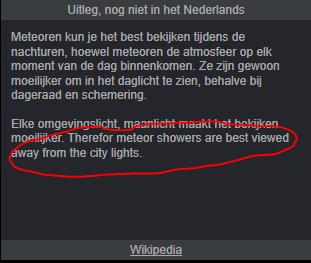
Got an alert yesterday when Kp =5.7: “144 MHz Radio Aurora Possible”.
What does this mean?
Popup in sun block => Visual Aurora Borealis/Northern Lights and VHF Radio Aurora Indicators
Need to add proper links as the one used in the pop-up is broken
Wim
AFAIK a Radio Aurora emits radio frequencies at around 150 kHz. Is it used here to suggest that enhanced auroral propagation might be possible at 144 MHz?
Thank you very much for help.
I have replaced the files on the server with the downloaded ones and now I have data since July 25th.
Maybe I’m still doing something wrong? :oops: :oops:
-Month and year rainfall chart shows some strange and very small numbers. I can’t see what’s showing. Maybe rainfall in inches divided by 10 ?? For example, the precipitation for August 7 shows 1.31 mm. The correct number is 33.27 mm.
Those scripts and alerts are from the 2017 version.
I only converted the script to this version.
Wim
Sorry, :oops: :oops: :oops: :oops: :oops:
I thought you were using weahterlink.com also, just as iLORRAIN102 / 49.
The graph files are converted from the .CSV with the same units as the data from the weather-program.
WL.com is always in imperial. With WU one can choose and you are using default metric.
The files are regenerated on your site, and the graphs look OK to me.
Wim