thank you for the script i just did the test actually we found the files txt pr against in my case we return to the starting point ... to go back, just delete the files in the folder "chartsmydata /"?
Regards
The version of the script I posted yesterday, only converts the WU file without adding missing data. So yes, only the available data until July 25 was generated.
The new version (planned for this weekend) of the script reads the WU-api and tries to add missing days. I was glad to test that new script with your ILORRAIN49 data.
Attached the chartsmydata/ folder with all available from the .CSV and the WU-api history.
The only days missing are 2019-07-27 2019-07-28 and 2019-08-12
Unzip the folder and move only the 2019.txt and 2019_08.txt to your website => chartsmydata/ folder.
@ALL
Very strange, it seems that the new data base has it flaws also. There are more and different days missing in the dashboard as in the .CSV
I do need some other wu_ID’s with missing data to test with.
Post or PM me your wuID if you have missing data in the .CSV which, in your opinion, was uploaded correctly to WU in the past.
@Wim
i made the correction on my site
thanks for the returns
it seems to be ok
I have another station MeteoLive ID_WU "ILORRAIN102"
I am installing the template for this second station
to be continued
REGARDS
thnx it seems to be functional at this stage enjoy …
good evening fto
rectified i have just seen my colors are absolutely discordant (month / year) ??! ide. for my first site
I do not understand your remark.
What is your problem and is it on this site? http://valdefench57sgz.franceserv.com/pwsWD/index.php
The graph colours has always been this way. Maybe a small screenshot would help to clarify.
Discordant colours are those that are almost opposite each other on a colour wheel. In colour theory, a complementary colour is the one directly opposite of a colour.
===
I checked your website and I found an error in generating the files when using weatherlink.com
The values should be in imperial units, same as the data from wl.com, but they were in your default units.
To test, I regenerated the year and month files for ILORRAIN102
If these are correct, I will regenerate the ones for your first site also.
hello
sorry for the confusion :oops:
affirmative for the graphics put i had not thought of WL since my datas were correct
thanks for the file ok the values are (finally) consistent
please opportunity to have those for my first site “ILORRAIN49”
have a nice week end
Regards fto
thanks for the file
OK relative to the graphics it seems to be good now except for those of the rainfall (month ! / year ??) for the 2 websites … unless otherwise stated !
best regards
The last original pop-up contained errors in the data as detected by @beteljuice.
He / she also pointed me to the correct source for that data, thanks =D>
I had to rewrite the script to remove the html warnings a.s.o.
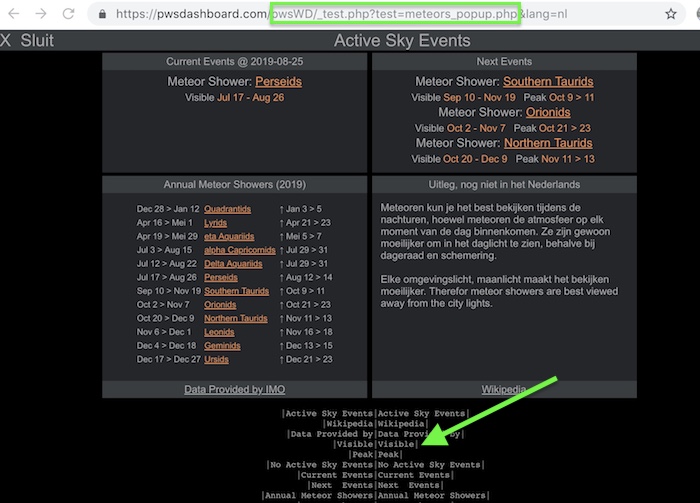
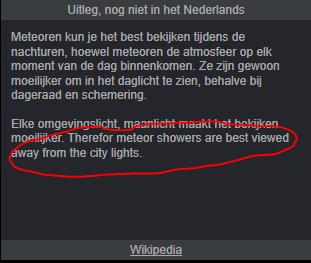
It will display the current and 2 next meteor showers, sun & moon eclipse and now contains clickable links to the wikipedia descriptions and IMO calendar.
Yes on purpose as not all languages had decent translations.
Translations will now work and caused by some remarks of @beteljuice I added more information. F.I. peak dates now show the period, not the first day.
Also the new pop-up look as with the UV pop-up, so without the “very contrasting” white borders
As far as I can see the script it is ready for use.
===
For those helping me with testing the script, at line 1512 one can set the current date to any value for this year.
Also test with either the debug console (w34_module_test) or with _test.php https://pwsdashboard.com/pwsWD/_test.php?test=meteors_popup.php&lang=nl
Both will show the PHP errors and list the missing translations. UPDATE: New zip, I removed typing error , missing translation in large texts should work
Wim
P.S., Back to the WU convert script, which needs some documentation #-o
I generated the graphs data-files, please unzip attached folder and put the contents in your chartsmydata/ folder
The files contains all available data from the .CSV Most of the missing data could be loaded from the new WU-database, but not all. 2 days are still missing.
As with other users, your new WU-dashboard is missing more days for July
I attach a “release ready version” of the convert script for users of the July version
I could test the .CSV files from about 5 users, but sadly only for 3 weather-programs. Maybe there are bugs left.
After converting your wuID.CSV file, the website files can be used for your graphs.
They are at least as complete as the combined WU data from the .CSV and your WU dashboard.
Change the easyweather setting for which graph-files you use.
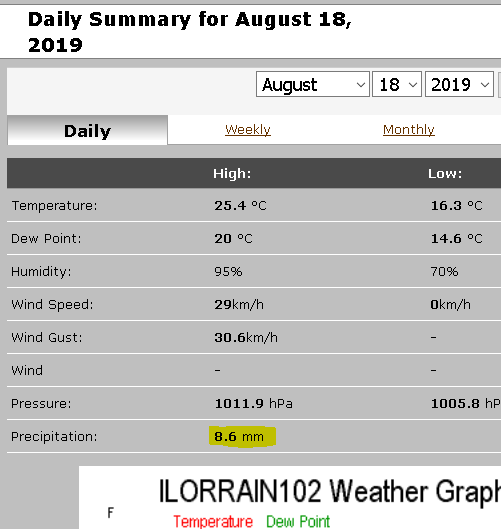
for me it seems to me that RAIN graphs are corrupt? no ?
example: rain / month dated 18.08: charts_graphs = 86.36mm while value recorded by the station was 8.6mm
it is this value that gives me for example the execution of the last script “WUhistory” of Sratoga
ps./
for ID = ilorrain49 same inconsistency
charts_graph for 18.08 = 99.06 mm vs./ good recorded value = 9.9mm#-o#-o