The template name: WD34, the release 1907 (July 2019) is in the footer.
Post your
You should not to have to clear the cache (with FTP).
All is needed is a force reload which “refreshes the cache for the current site only” => “ctrl” F5
=> Refresh your cache - When hitting F5 just isn't enough!
So the old xx.png will be reloaded with a new version, if it is changed or not.
Sometimes this is also necessary when a css file is changed.
Wim
OK. I think I have a solution.
There is also a 7day summary for uploading-users with an API-key.
That summary is updated every 30 minutes or so, not 1 / day as with the daily summary.
So I adapted the load data scripts
And in the live data the current temp/wind a.s.o. are checked with the available high-lows also.
I attach the two scripts, make a copy of the current ones before replacing with these test-scripts,
Wim
P.S. Ken True (Saratoga) found a solution for the data without decimals, it seems to work and is tested for a few days at
The current data with decimals will really make a nice dashboard, I think
wu_daily.zip (13.6 KB)
Now it looks right with me. Thank you very much.
Unfortunately, I have discovered a new mystification. When I want to see values for this month, the scale stops at July 25.
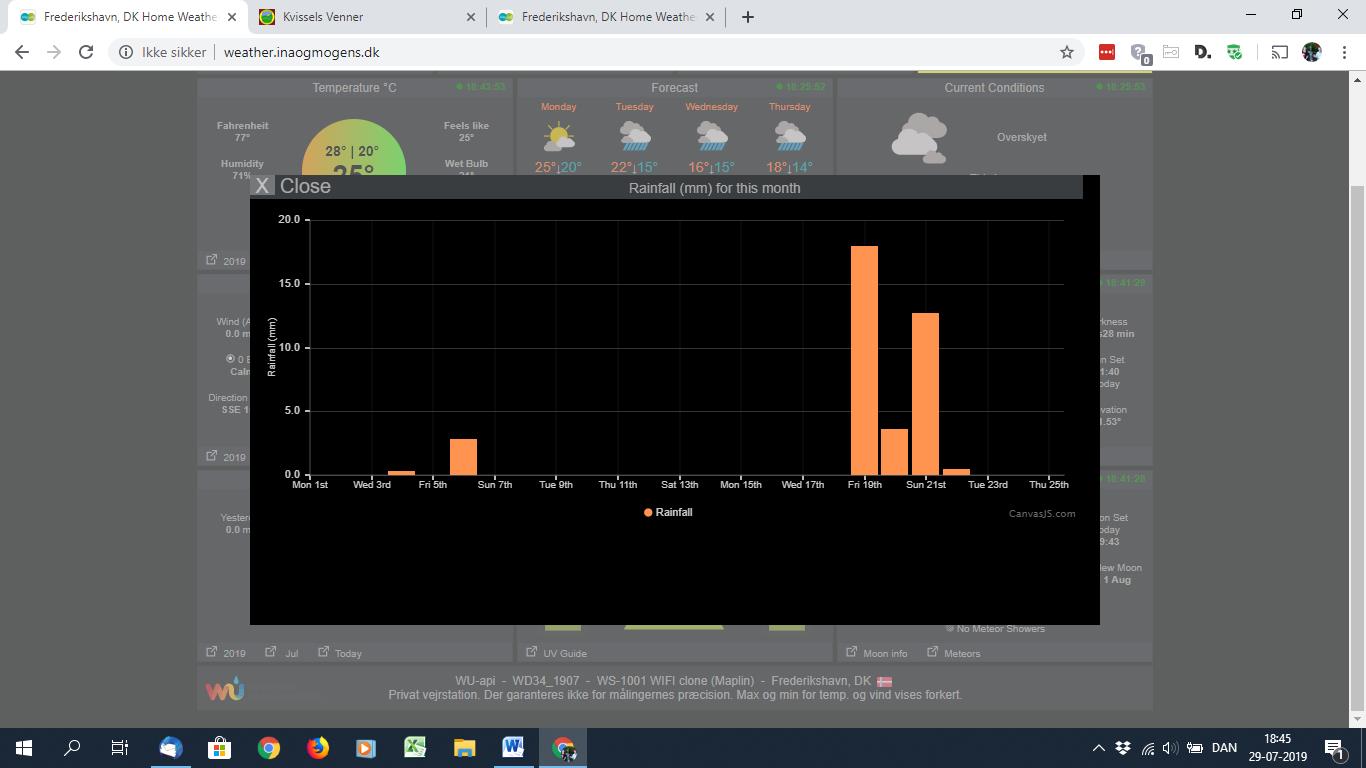
Yes, that is the problem with the “old” / “shortly retired” / “maybe not” .csv data
There seems to be a recurring problem with every station for a few days every now and then.
I myself missed some days in June, Rapporten - Leuven-Sluispark
they appear on the WU-dashboard so they are in the TWC.com database.
But not in the WU downloads. => https://www.wunderground.com/weatherstation/WXDailyHistory.asp?ID=IDKFREDE2&graphspan=year&year&format=1
There are multiple persons working to find a solution to add missing days probably by using an API-key load.
There will be a solution for this in the coming months, but only if WU decides to keep the .csv downloads operational.
For the October version I am now adding other graphs by using the API: detailed graphs for today & yesterday and high-low graphs for last 7 days, last 31 days a.s.o
Wim
Hello Wim,
I tried your new scripts (WU data) but decimal for temperature is not working for
[quote author=weather-at link=topic=68132.msg548804#msg548804 date=1564563676]
Hello Wim,
I tried your new scripts (WU data) but decimal for temperature is not working for
Please test attached script.
P.S. I have already changed units “KMs” to “km” in the attached screenshots of my block.If you changed the script for that: It is easier and more future-proof to use the translation files for that.
. . . shortened . . .
Wim
earthquake_c_block.php.zip (3.37 KB)
I’ve installed a webcam and downloaded the zip file and updated the website.
No longer is there a blank screen on the pop up when viewing with MS Edge or Chrome on a Windows PC but there’s still a blank page when using Safari or Chrome on an iPad or iPhone (and it’s not a cache issue if that’s relevant).
http://www.collapit.org.uk/pwsWD/
Thanks as ever for your hard work, Wim
This is not a PWS-dashboard problem, it is a http://collapit.ddns.net:8081/ problem.
Using an iPad: I tested with your site and with Leuven Home Weather Station (wf version) (also uses WU + webcam)
Your site does not display the webcam image most of the times as the image from http://collapit.ddns.net:8081/ never fully arrives, the browser is still trying to load data, even if the data is “almost” there.
I opened http://collapit.ddns.net:8081/ on the iPad it never shows the received data.
On a mac it shows the image but still tries to fetch more data.
===
I think you should change is in such a way that the camera should not be accessed for the image.
The image should be uploaded every so many minutes and then accessed from the website as a normal image.
Wim
That works ok, thanks Wim.
If you changed the script for that: It is easier and more future-proof to use the translation files for that.
I only changed the translation files!
=D>
Please test attached script
(But I haven’t worked out why max wind time was still showing 14.20.)Around midnight there is a lot of housekeeping for a weather-program: min/max today, yesterday values, optional min/max month/year a.s.o.
All OK this morning
So it is often that until some time ( 1/2 hour) not all values are initialized. The times will be correct after the first non-zero measurements.
Wim
wind_c_small.php.zip (2.31 KB)
Sorry, it’s not right when I really look at it: the depth is always reported and shown in km, so the depth units have to stay in km whether the distance is shown in miles or km.
Done and thank you for the solution Wim
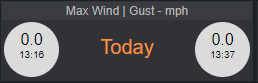
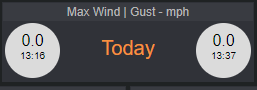
Seems to work OK, at least the gust does not disappear altogether. Screenshot wind.png taken at 0001.
Around midnight there is a lot of housekeeping for a weather-program: min/max today, yesterday values, optional min/max month/year a.s.o. So it is often that until some time ( 1/2 hour) not all values are initialized. The times will be correct after the first non-zero measurements.
I guessed as much when I said
It seems that neither %maxavgspdt% - "maximum average wind speed time" - nor clientraw [135] - "max gust today time" - is reset at midnight.
Waited until 0015 - wind15.png - but no change to times. It’s past my bedtime ![]()
Hi Wim
Under the Current conditions This Hour it has the temp at 30c but the actual temp is 10.7c, I am not sure where that temp is coming from.
http://www.mangawhaiweather.co.nz/pwsWD/index.php
Thanks
Tony
There are two parts: The top part is, in your case, the current conditions from WeatherDisplay.
The bottom part (with the 30C) is the current “this” hour forecast, from DarkSky.
Add a DarkSky key and that information will also be current,
Wim