No, no luck. Renamed us.svg to xx.svg (Renamed the old xx.svg first) and changed Easyweather to “Your Country” also changed $flag in wd34settings1.php to xx.svg. Still loads with British flag. Also on numerous occasions when I save Easyweather, it reverts to a different version and my changes are gone.
John, I ran in to the same problem with the flag and couldn’t understand why changing the name to xx wasn’t working. It wasn’t until I tried my site in a different browser that I realized it was a local caching issue.
Well, I thought it was working!! As soon as I open Easyweather and save close it reverts back to UK flag. It is like it is opening an old file. If you have to clear the cache to go into settings that just isn’t going to work.
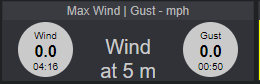
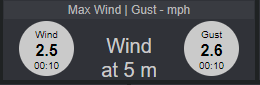
It seems that neither %maxavgspdt% - “maximum average wind speed time” - nor clientraw [135] - “max gust today time” - is reset at midnight.
I refreshed the WD34 page (Ctrl-F5) at 0002 this morning and got noreset.png, attached. At 0014 everything was OK again, see reset.png. (Clientraw is uploaded every 20 secs, and customtextout every minute, so that should not be a problem.)
Thank’s for your quick answer. It will be useful to have the list off the release and the version of the zip file. Perhaps also the current version in the footer?
You should not to have to clear the cache (with FTP).
All is needed is a force reload which “refreshes the cache for the current site only” => “ctrl” F5
=> Refresh your cache - When hitting F5 just isn't enough!
So the old xx.png will be reloaded with a new version, if it is changed or not.
Sometimes this is also necessary when a css file is changed.
OK. I think I have a solution.
There is also a 7day summary for uploading-users with an API-key.
That summary is updated every 30 minutes or so, not 1 / day as with the daily summary.
So I adapted the load data scripts
And in the live data the current temp/wind a.s.o. are checked with the available high-lows also.
I attach the two scripts, make a copy of the current ones before replacing with these test-scripts,
Wim
P.S. Ken True (Saratoga) found a solution for the data without decimals, it seems to work and is tested for a few days at
The current data with decimals will really make a nice dashboard, I think
Now it looks right with me. Thank you very much.
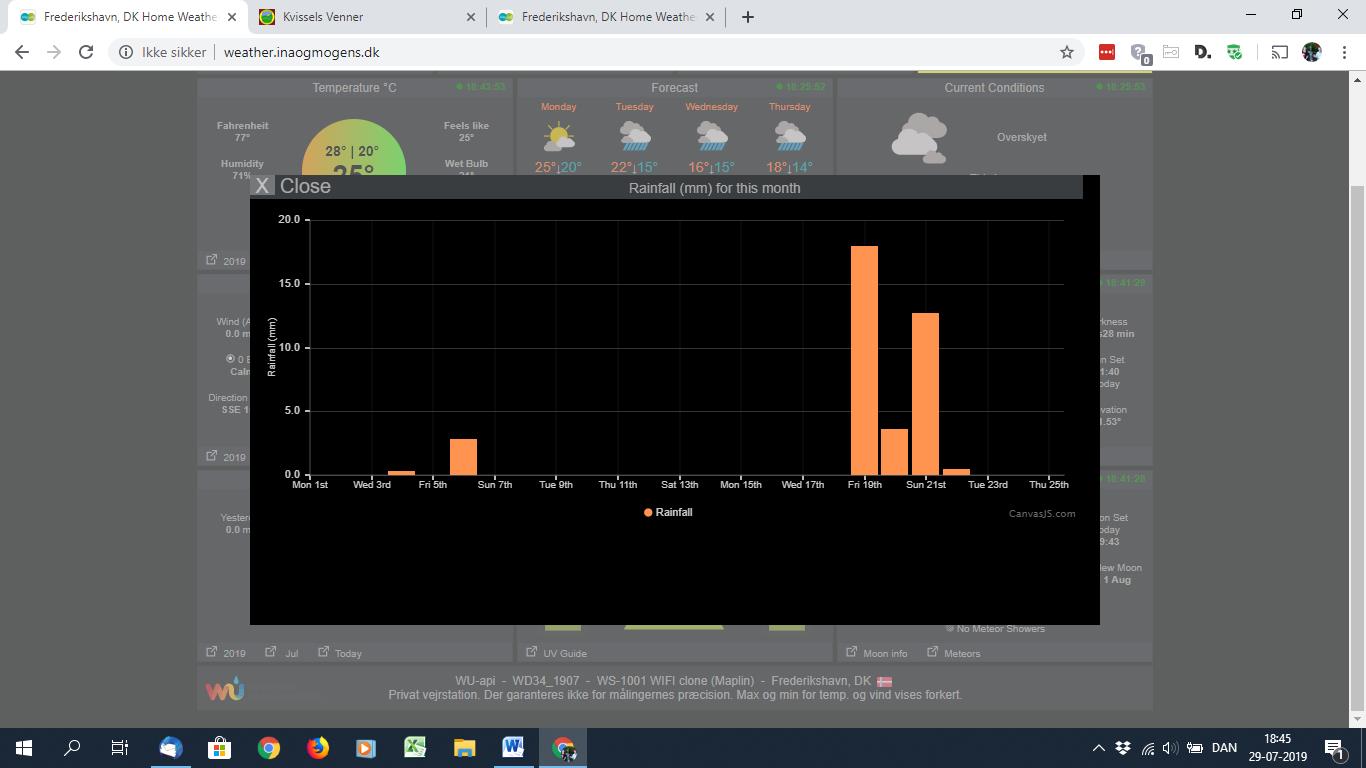
Unfortunately, I have discovered a new mystification. When I want to see values for this month, the scale stops at July 25.
There are multiple persons working to find a solution to add missing days probably by using an API-key load.
There will be a solution for this in the coming months, but only if WU decides to keep the .csv downloads operational.
For the October version I am now adding other graphs by using the API: detailed graphs for today & yesterday and high-low graphs for last 7 days, last 31 days a.s.o