Hi Brian,
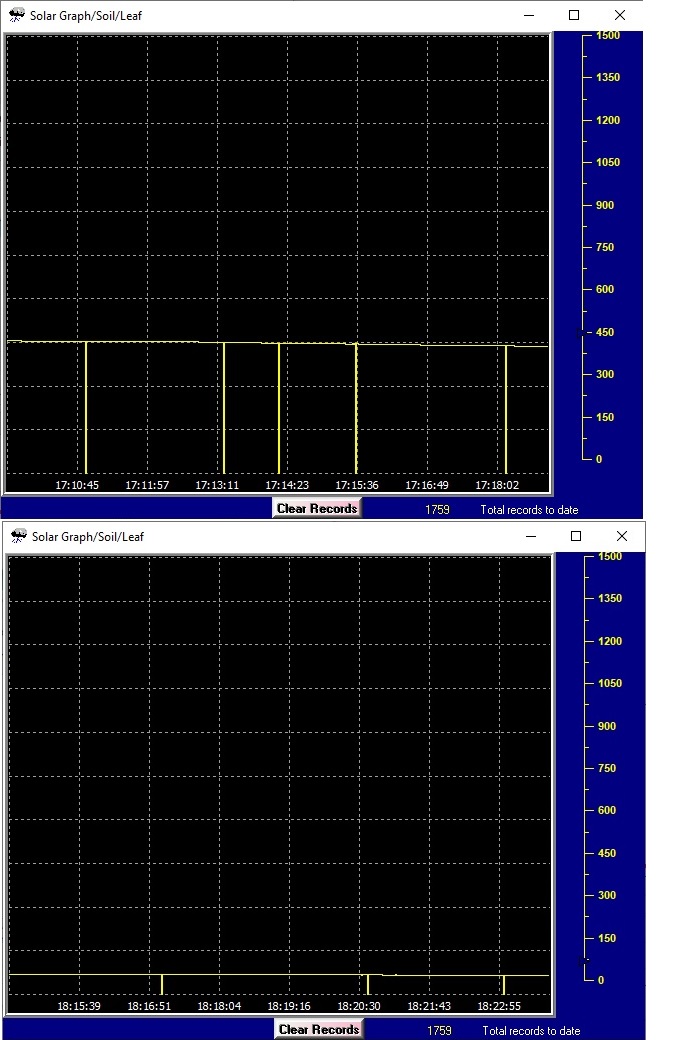
I just noticed the solar livedata has very frequently a drop in the live reading.
See attached pic.
I did some research today and noticed that the source is good, no spikes in live data.
I havent got an error in the debug info.
Is there something i can check settingswise?
I have the CR1000 datalogger and latest build of WD in use.
Hi Brian,
As a test, i have run taskmanager screen next to the realtime solar screen to see when the glitch happens, taskmanager shows something.
But nothing is shown when it happens.
Loggernet is running that realtimedata ok.
your statement is a bit confusing
Sorry Brian,
Ive tried to see whats going on in taskmanager while the glitch happened.
But nothing happened in taskmanager that could cause the glitch or strange behaviour.
Sorry for being not so clear :oops:
do you mean windows task manager?
not sure how that would help you see what is going on
Yes, i thought maybe something happened in windows 10 during the glitch to rule that out .
Hi Brian,
I managed to record the event with a screenrecord app.
As you can see, the actual solar value on top of the mainscreen doesnt make the dip like in the realtime solar graph.
https://youtu.be/D2GxYPRR4Sk
Hi Brian,
I noticed during every minute change the live solar data in WD has a drop in the reading, see video.
Ive the live solar data from loggernet (same live data source) shown below the WD reading.
https://youtu.be/ImVUUpx5y5k
I am not sure at this stage why that is happening
but do though check over your settings in the solar setup, max solar for lat/long, are set correctly
Thanks, ill have a look when im home.
Solar setup is set right.
As a test i ran WD with Cronpakbusnew.exe as data feed and that worked fine.
So it has to be something within the WD Campbell Scientific setup i guess.
Its possible i continue using WD with Cronpakbusnew.exe but then im not using the full potential of the Lufft precipitation sensor.
When running WD without Cronpakbusnew.exe im using the full functions of the Lufft precipitation sensor with Loggernet.
Currently the table data available are:
field windspeed=Public.Windskm
field direction=Public.Windr
field humidity=Public.Vocht
field barometer=Public.BP_mbar
field rain=Public.Rain_mm
field precipitation type=Public.Precipitation_Type
field solar=Public.SlrW
field battery=Public.BattV
field temperature=Public.Temp
When im running WD with the Cronpakbusnew.exe (without Loggernet running and without the options to read and measure the precipitation types with Loggernet), i ideally need the data tables seen below wich i can program to get live pulse data, except the Total precipitation:
field rain=Public.Rain_mm
field snow=Public.Snow_mm
field sleet=Public.Sleet_mm
field freezing rain=Public.Freezing_Rain_mm
field hail=Public.Hail_mm
field total precipitation=Public.Total_Precipitation_mm (the current Public.Rain_mm wich show total)
Is it possible Brian to get those values in realtime shown? For example like the raindata on the mainscreen WD.
When using WD with the Cronpakbusnew.exe setup, currently its generating 60 CSV files to check for possible missing windgust.
Maybe that file can be used to check for possible missing precipitation types and amount when the extra data tables are in use?
The current
Just a thought Brian 
With kind regards.
Hi Brian,
What do you think about my suggestion so WD is able to use the full potential of the lufft sensor?
With kind regards.
Hi Brian,
Is this something that can be implemented in WD?
With kindest regards.
no its not, sorry, its not something I am prepared to work on, as its just likely to lead more problems, more questions
Hi Brian,
I could make a donation if you like.
But if you are not prepared to work on i respect that
With kindest regards.
Hi Brian,
I hope youve had a nice holiday?
Question id like to ask if its possible to have the precipitation value (10, 20, 30, 40 or 50) shown on the mainscreen graph above the rain graph? For example on the humidity scale in the form of dots or cross.
I can make an adjustment in my loggernet program so in case of a precipitation event the most occurred precipitation type is shown in the precipitation type custom tag already in WD.
And the possibility to have the rain graph on the mainscreen set to 1 instead of lowest possible value of 5?
Because my rain amount are in the 0.01 mm factor, which isnt visible on the raingraph on the mainscreen WD when the lowest possible value of 5 is selected for the raingraph scale.
With the kindest regards.