I like postprocessing the WD’s log files but often have problems with X scale (time). WD has it nicely separated by columns (day,month,year,hour,minute,data) but when I go to Octave/Matlab, I find it difficult to convert to time. I want to plot the ET value now which is being accumulated over the day until hour 23:59 (max of the day). Values are stored in the monthly log file so I should additionally check the day column.
Does someone have a hint how to manage the timestamp columns properly in Octave/Matlab so I can plot it easy?
Many thanks.
If you use a custom logfile you can get the data/time in a format that your back end program can accept, that’s what I do. I see matlab can convert text dates to a timestamp using datetime like
t = datetime(d,'InputFormat','dd-MMM-yyyy HH:mm:ss')
Have you tried that, specifying the logfile date/time format? I think that should work unless matlab can’t handle the varying number of spaces WD uses as the delimiter. You could pre-process the logfile with e.g. Python to either fix the delimiters, or convert the date/time fields to a standard format.
I use WD’s standard log files (the .csv format with comma delimiter). For now, I managed to do something useful in several ‘for’ loops (looking for day and hour/minute) but it’s not very nice. I’ll try your suggestion - I use custom log files for plotting on the webpage with plotly. It accepts the ‘YYYY-mm-dd HH-MM’ format directly.
Thanks.
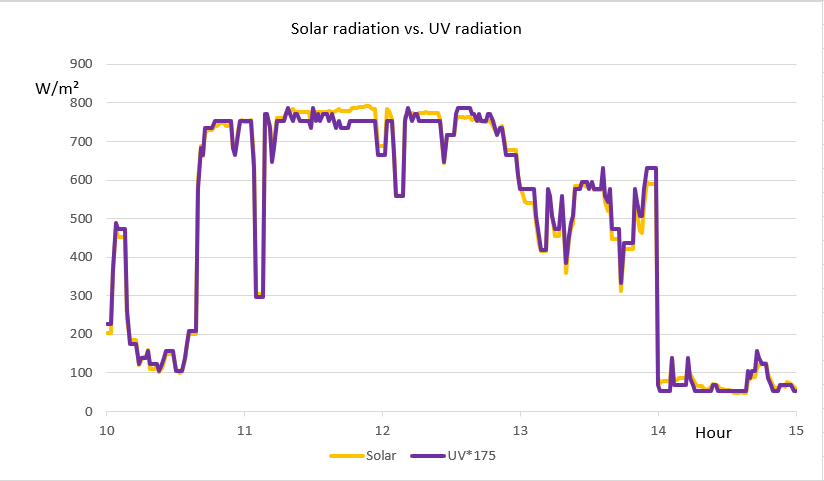
It may be a hammer to crack an egg, but I use Excel with only one proviso. Before importing the data, I change all the double spaces to single spacing. During the import, I use the space as the column delimiter. After that, everything is straightforward and I often make graphics. Although I have not made it pretty, the attached file gives an example of the solar and UV data over the few hours around midday.