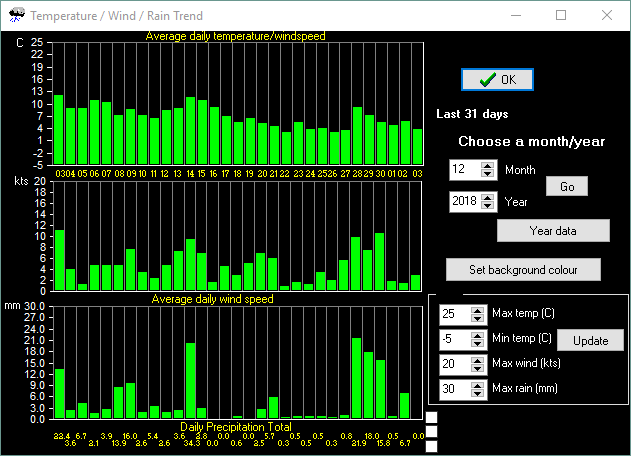
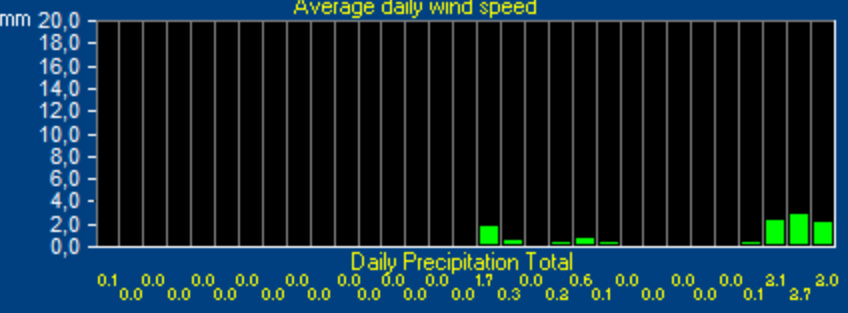
Further to previous post, I am still getting a malfunction on the Temp Wind Rain Trend chart. The attachment clearly shows the bar graph reducing the daily rainfall by around a third on the left hand side of the graph. The numerical values on the x axis are correct, so this looks like a graphing issue.
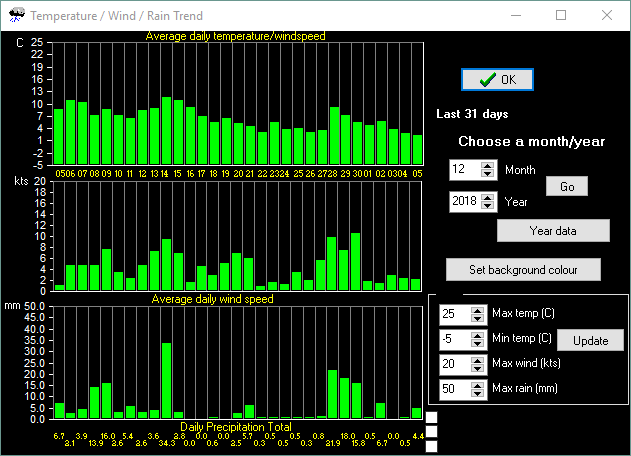
For anyone else with this problem, I have found a workaround to fix the Rain graph malfunction. For some reason, the daily bar graphs on the left hand side of the chart show values based on a max scale value of 50mm. If any other scale is chosen, the graph values will show incorrectly.