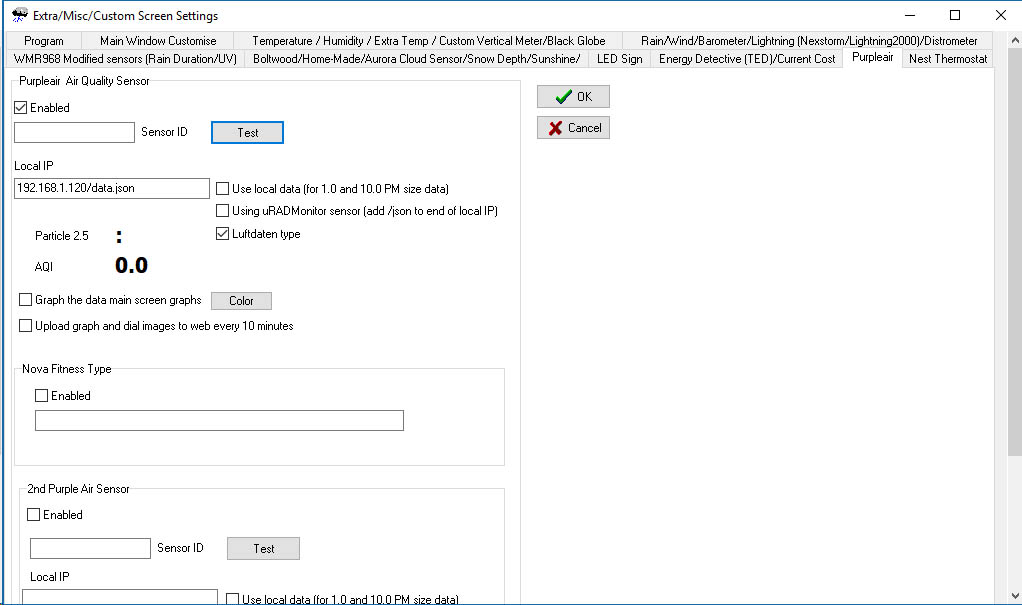
If I enter local IP address as 192.168.1.120 in the IP address box (the network address of the sensor unit), 2455820 in the sensor ID box, tick luftdaten type and then click “Test” I get error message “276:error during handshake(2) 0x80090308”. The result shown in Particles 2.5 is “Values” and AQI result is 0.0
The only other box ticked is “Enabled” The number 2455820 I entered is the local sensor number but the same result occurs whether the box is populated or not.
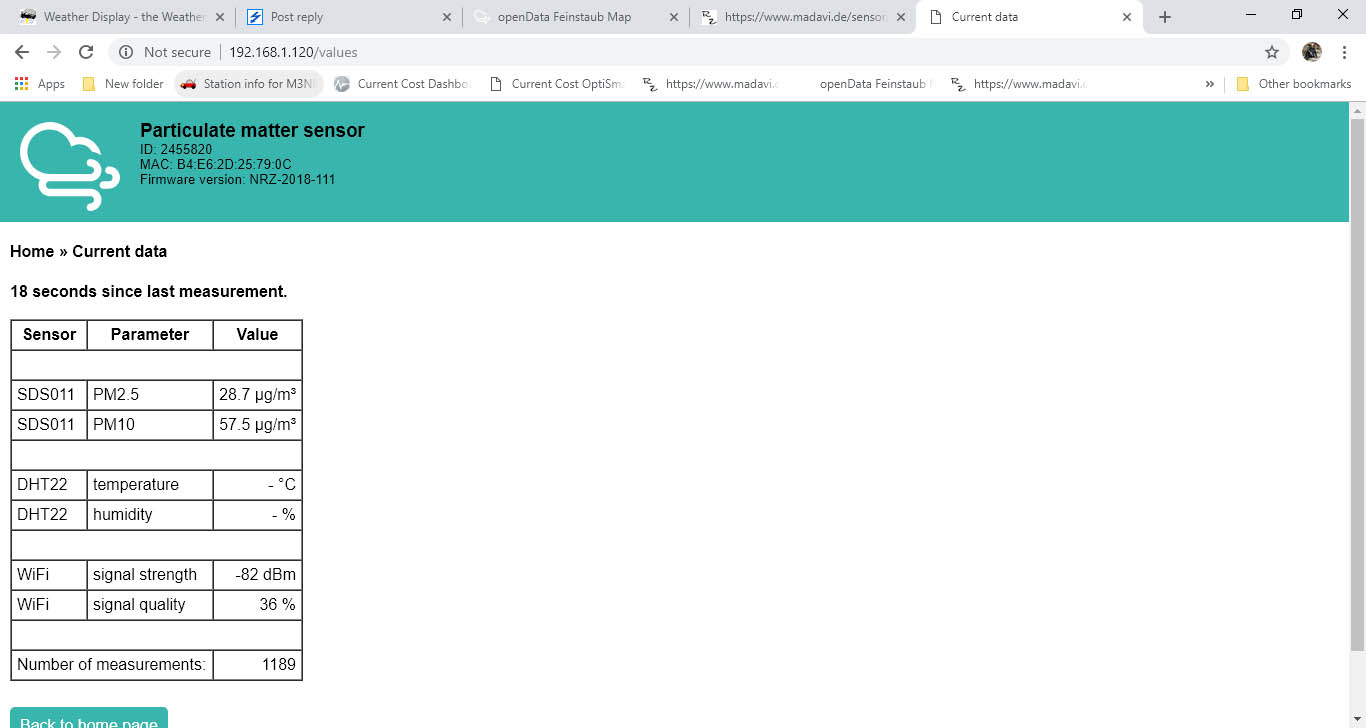
To double check the sensor was working, I accessed the sensor via a browser using that IP and was able to get in to the interface just fine.
Just in case I misunderstood I tried the URL method suggested by Wim.
As per Wim I entered http://api.luftdaten.info/v1/sensor/14396/ in the IP address field (where 14396 is my Luftdaten sensor ID) and then clicked “test”. This didn’t produce an error message but only returned “Values” and “0.0” respectively.
The particle value shown on screen is odd (see attached screen grab)but only looks like it’s picking up the wrong field. The P2 data in airquality2.txt matches the current value in the sensor.
yes, hopefully now WD should be running the cronairquality.exe program every minute and updating the data auto now
for PM2 and the calculated AQI
for now at least
I could add in to get PM1
The aqi charts are being produced but are straight lining at zero and I would have imagined the first readings would have shown by now. As I said, I’ll leave overnight and see in the morning
Thanks Brian, I have done that and it’s been running for a while now.
The aqi graphs in webfiles aren’t being produced although the aqi plot on the main screen graph has received just one plot, there isn’t a scale showing.
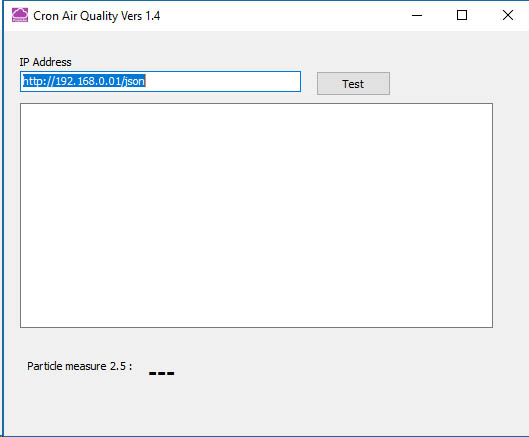
I’ve attached the aqi screen grab from the view menu, it now reads zero and has one plot shown
Ah ha! View menu screen shows correct PM2 reading now and an AQI level, the main screen graph now shows the AQI and it is being plotted (see attached). I will need to investigate how AQI is being calculated so can’t vouch for that but will assume correct as PM2.5 is correct.
The AQI charts are being updated in the webfiles folder but don’t seem to change their timestamp, properties shows to have been modified rather than rewritten so I assume that is normal?
I’m off to bed now but will check again first thing, it certainly looks ok
Been running 12 hours now and seems fine as far as I can see. Sensor readings and graphs seem fine. This is a quick and dirty web page using the WD gifs https://www.sunwharf.com/willingdon/aq.html
I’d like to create a rolling 30day graph, which log file has the data in please?