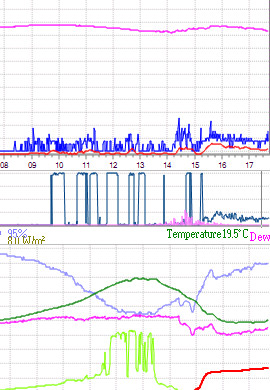
Yesterday, we had the mother and father of a thunderstorm, some 15 km N of here, with WF measuring over 1100 strikes between <5 and >30 km distance from here. I attach the WD plot of the event in dark magenta on the wind direction graph. It seems to me that the visual info is rather lacking. How can I increase the Y axis response, to give a better visual representation of the parents’ storm?
