Fire season has started in the West

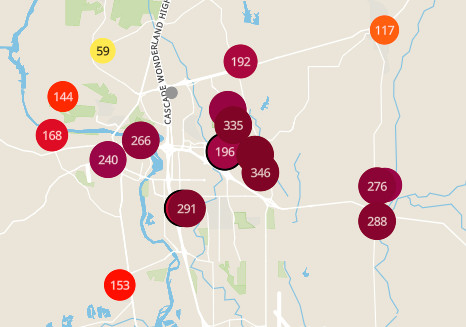
Well, our air quality went into the toilet today with a lot of smoke and haze. After running around 100 AQI for over a week, the AQI jumped to over 150 this afternoon. Right now, my sensor is reporting 156 AQI and AirNow is reporting 158 AQI. How’s that for closeness? And it is supposed to get worse tomorrow (Friday). I received the following notification late today.

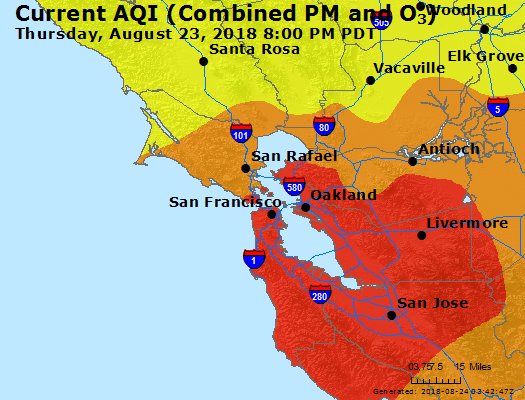
[size=83]A Spare the Air Alert is in effect, Thursday, Aug. 23, and Friday, Aug. 24, for the San Francisco Bay Area.

The unhealthy air quality is due to wildfires. If you see or smell smoke, take steps to protect your health.

This unusual later afternoon alert is being called due to poor air quality conditions developing throughout the region as the result of smoke from wildfires sitting out over the Pacific Ocean and blowing into the region.

Air quality is forecast to be unhealthy today, Thursday, August 23, and tomorrow, Friday, August 24, 2018. The unhealthy air quality is due to wildfires in California, Oregon and Canada. Air quality deteriorated quickly this afternoon due to large plumes of smoke over the Pacific Ocean mixing in with fog and being carried into the Bay Area.

Spare the Air Alerts are called when air pollution is forecast to reach unhealthy levels. Climate change has contributed to longer wildfire seasons which impacts air quality. Smoke can cause throat irritation, congestion, chest pain, trigger asthma, inflame the lining of the lungs and worsen bronchitis and emphysema. Smoke pollution is particularly harmful for young children, seniors and those with respiratory and heart conditions.

When a Spare the Air Alert is called, outdoor exercise should be limited. Residents are encouraged to reduce air pollution every day by rethinking their commute and avoiding driving alone, choosing electric lawn and garden equipment over gas powered and not using lighter fluid on barbecues.

This AirAlert is provided by the Bay Area Air Quality Management District. Thank you for doing your part to Spare the Air!

Do not reply directly to this email. If you want more information on the air quality forecast, or other aspects of the local air quality program, please contact your local air quality agency using the information above. For more information on the U.S. EPA’s AIRNow Program, visit http://www.airnow.gov. [/size]


cur_aqi_sanfrancisco_ca.jpg

As an added tidbit, when I compare the PurpleAir map with the sensors on the AirNow.gov map for the SF Bay Area, they are all reporting about the same everywhere. So, chalk one up for PurpleAir. :slight_smile:

https://www.purpleair.com/map?317376|317379#9.46/37.6157/-122.2231

Oops! I just noticed that you have to cut and paste the URL to get it the whole link otherwise it gets cut off at the | when you try to click on it.

Working link

or you can replace the | with %7C

https://www.purpleair.com/map?317376|317379#9.46/37.6157/-122.2231

Thanks, Niko. I’ll keep that in mind. The air quality around here seems to have gotten better now but, we’ll have to see what happens when the afternoon westerlies kick in.

Shasta County Air Quality Management District has discovered the PurpleAir sensor and installed a bunch of them so now we can see on the PurpleAir Map just how bad the air is around here due to the fires. At time of writing the worst station is showing PM2.5 AQI of 374 with many stations over 300.

The wildfire season isn’t over yet here. Smoke from the Camp Fire in Butte County has made it’s way to the Bay Area. Most of the PurpleAir sensors including mine are registering over 200 AQI. One problem is, my sensor is registering on the PurpleAir map but, it shows 0 in WD. Did something break?

http://ucweather.org/wxaqi.php

We thought the Carr fire was bad, but the “Camp” fire has burned 70,000 acres of woodland in less than 24 hrs 8O

It is amazing. I read that at one time, the Camp Fire was spreading at the rate of 80 football fields an hour. This seems to be a repeat of the Branscomb Fire near Suisun City that occurred a month ago, same scenario where the wind was blowing all that smoke down into the bay area and the air quality went into the toilet. I hope the wind conditions change soon. The air quality is pretty bad and they say it’s supposed to be like this through the weekend. My air quality information page is sure getting a lot of attention.

According to the 6PM press conference it’s now 90,000 acres and has become California’s most destructive fire in history, having leveled 6,713 structures. The vast majority were homes: a total of 6,453.

Regular evening wind shift to the south, now we have the smoke:


camp.jpg

Geeez, just what we need, another historic wildfire. :frowning:

I would like to know what’s going on with the AQI graphics created by WD. It seems like when the AQI hit around 175 AQI, they stopped recording anything or recording garbage. The first graphic is from PurpleAir map which appears normal but the aqi.gif and aqichart.gif are messed up. Any ideas?

Edit: I just took a look at Ken’s AQI page Saratoga-Weather.org - San Jose, CA Air Quality Index and the Realtime AQI chart on his page is doing some weird stuff too.

Edit: Brian, there seems to be a problem with WD creating the PurpleAir graphic and graph when the AQI gets over 175. Can you take a look?


aqichart.gif

what sensor is this?
purpleair?
I will need a copy of the airquality.txt and airquality2.txt files

I think the Purpleair.com network started having problems yesterday around 2am pacific time (when my graphs went all funky too).

Looking at the purpleair.com map shows large number of stations as ‘not reporting’ (mine was on the list for a while too).

Let Purpleair.com fix the upload/propogation issues, then let’s worry about the WD access/graph/tags creation.

I filed a Bug issue about this earlier today.

It looks like they got the problem resolved, for me anyway.


aqichart.gif

did anyone manage to get a cop of the airquality.txt and airquality2.txt files when it was not working in WD?

Nuts! Sorry Brian, I was going to do that today. I hope Ken got a copy of them.

Yes, and I’m not showing as ‘online’ with purpleair.com map at this time.


airquality.txt (1.26 KB)

airquality2.txt (1.8 KB)

airquality4.txt (943 Bytes)

aqichart.gif

the airquality2.txt file has a “PM2_5Value”:“46.02”,
and WD is picking that up OK here
(and gives an AQI of 126)

I think the underlying problem is that some Purpleair stations are not getting good uploads and we appear to be in ‘bunches’ on the map … my station is offline to them right now, but a local check shows it is displaying current values. Very strange.

The WD graph is likely wonky due to the intermittent nature of the data on purpleair.com/json feed for the station.

My testtags.php shows

//==========
$purpleair2_5 = '46.0'; 	 //Value of 2.5 micron particle measure from purple air sensor (see in WD under setup, advanced/misc)
$purpleair1_0 = '186.2'; 	 //Value of 1.0 micron particle measure from purple air sensor
$purpleair10_0 = '282.3'; 	 //Value of 10.0 micron particle measure from purple air sensor
$purpleairaqi = '126.9'; 	 //AQI (air quality index) value from purple air sensor
$purpleairaqidescription = 'Unhealthy for Sensitive Groups ';	 //AQI description (e.g Good, moderate)
$purpleair60minmean10_0 = '287.0'; 	 //Last 60 minutes average PM 10.0 value
$purpleair60minmean2_5 = '46.8'; 	 //Last 60 minutes average PM 2.5 value
$purpleair24hourmean10_0 = '282.3'; 	 //Last 24 hours average PM 10.0 value
$purpleair24hourmean2_5 = '9.6'; 	 //Last 24 hours average PM 2.5 value
$purpleair60minmin10_0 = '282.3'; 	 //Min value in last 60 minutes PM 10.0 value
$purpleair24hourmin10_0 = '0.0'; 	 //Min value in last 24 hours PM 10.0 value
$purpleair60minmin2_5 = '46.0'; 	 //Min value in last 60 minutes PM 2.5 value
$purpleair24hourmin2_5 = '-1.0'; 	 //Min value in last 24 hours PM 2.5 value
$purpleair60minmax10_0 = '282.3'; 	 //Max value in last 60 minutes PM 10.0 value
$purpleair24hourmax10_0 = '282.3'; 	 //Max value in last 24 hours PM 10.0 value
$purpleair60minmax2_5 = '46.0'; 	 //Max value in last 60 minutes PM 2.5 value
$purpleair24hourmax2_5 = '56.0'; 	 //Max value in last 24 hours PM 2.5 value
$purpleair2_52 ='0.0'; //2nd sensor 2.5 reading
$purpleair1_02 ='0.0'; //2nd sensor 1.0 reading
$purpleair10_02 ='0.0'; //2nd sensor 10 reading 
$purpleairaqi2  ='179.8'; //2nd sensor aqi reading
$purpleairaqidescription2  = 'Unhealthy '; // 2nd sensor aqi description

so now the second sensor seems to be acting up. The local JSON shows

{"SensorId":"a0:20:a6:a:a2:7a","DateTime":"2018/11/11T22:32:11z","Geo":"AirMonitor_a27a","Mem":26264,"Id":397,"Adc":0.01,"lat":37.274700,"lon":-122.022903,"accuracy":0,"elevation":0.00,"version":"2.50i","uptime":15824,"rssi":-69,"hardwareversion":"2.0","hardwarediscovered":"2.0+OPENLOG+16021 MB+DS3231+BME280+PMSX003A+PMSX003B","current_temp_f":75,"current_humidity":9,"current_dewpoint_f":12.31,"pressure":1007.25,"pm1_0_atm_b":90.49,"pm2_5_atm_b":124.91,"pm10_0_atm_b":132.80,"pm1_0_cf_1_b":59.71,"pm2_5_cf_1_b":82.29,"pm10_0_cf_1_b":87.51,"p_0_3_um_b":13614.09,"p_0_5_um_b":4350.54,"p_1_0_um_b":661.03,"p_2_5_um_b":40.37,"p_5_0_um_b":9.34,"p_10_0_um_b":1.94,"pm1_0_atm":91.70,"pm2_5_atm":125.23,"pm10_0_atm":132.41,"pm1_0_cf_1":60.48,"pm2_5_cf_1":82.68,"pm10_0_cf_1":87.57,"p_0_3_um":15878.11,"p_0_5_um":4650.34,"p_1_0_um":680.86,"p_2_5_um":33.32,"p_5_0_um":11.14,"p_10_0_um":1.18,"responseCode":"504","responseCode_date":1541975527,"key1_responseCode":"200","key1_responseCode_date":1541962057,"key1_count":376476,"key2_responseCode":"200","key2_responseCode_date":1541962067,"key2_count":380139,"key1_responseCode_b":"200","key1_responseCode_date_b":1541962087,"key1_count_b":380002,"key2_responseCode_b":"200","key2_responseCode_date_b":1541975457,"key2_count_b":380852}

if you able to capture a data file when its not updating correctly in WD that would be good