Brian
attached two graphs with suspect info will send log file as seperate message…
the graphs show in graph 1, it does not show correct data from approx 1500 yesterday as graph time line has not caught up to todays time and data. data shows as a spike.
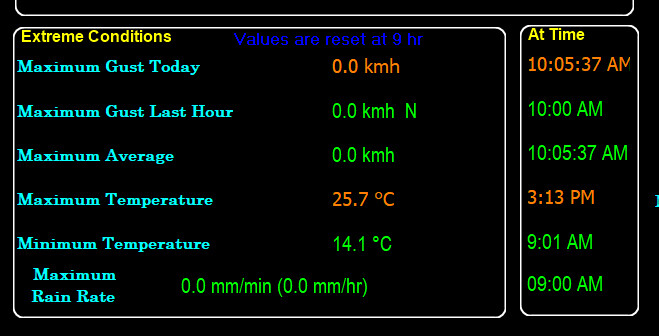
on graph 2 in extreme conditions section Max temp displays 25.7 @ 3:13 pm( Which is yesterday …??) and min temp is 14.1 @ 9:01 (today …? ) though the log file for today [ 18/05/2018 ] shows min temp of 14.0 @09:00…
There is no indication in Graph 2 that the max and min are todays or yesterdays …( ?? ) Can this be modified to display / indicate todays and yesterdays values …???