Hi for those who have it running,
Here are some options to think about.
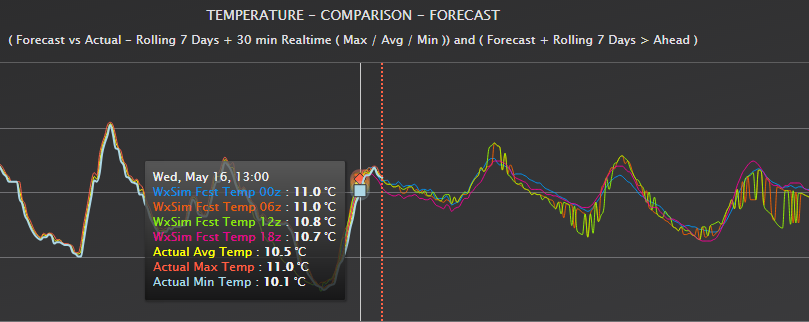
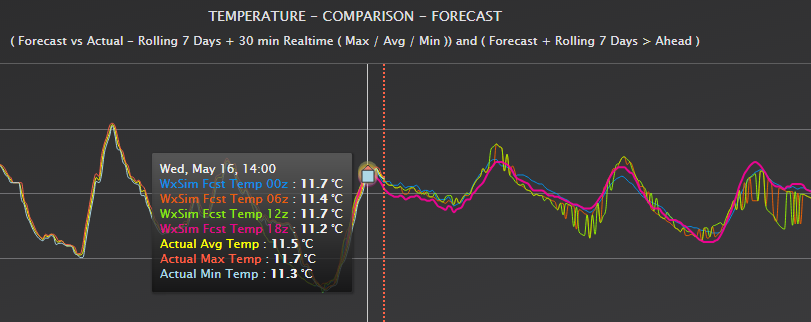
I added additional tables/views to look at each 00z/06z/12z/18z run.
Then quickly as an example produced the following: (excuse colors = was a quick example) to show Actual vs each Run.
Personally I will not be using the charts displayed below, but will eventually use the tables/views in additional compare table outputs and charts against the Cumulus Hi/Low from the Dayfile Table on a daily min/max total, with maybe some scoring applied
I have many more options, though they will take me months to refine. Now that you have the Import concept you can do whatever you like.
Another rough example of wxsim data : Sun Altitude Forecast : https://southfranklinweather.com/wxsimcsv/realtime_graphs_wxsim_sun.php could be done on day basis etc. etc.
Oh another real rough one for now, no additional runs added yet (that will be a long way off) nor are there Std. Dev / Success% etc. etc. as in Jim’s brilliant script as yet, time will hopefully change that.
It actually compares WxSim High / Low “Temperature” for the Day against Cumulus Dayfile Table data, also does same for WxSim’s Low and High Range forecast, which are LowTemp and HiTemp in CSV.
Example : https://southfranklinweather.com/weather/wxsimcompare.php
Ah well decided to add all 4 runs, not much data in those tables yet.
Images below Updated with current output.
kind regards,