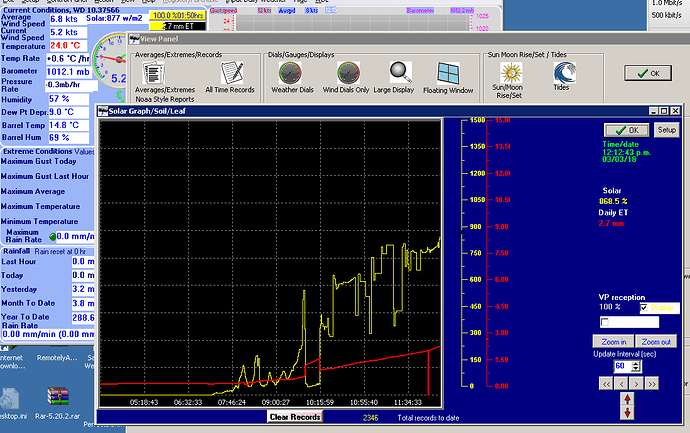
I’m just reviewing my settings for my Solar Real Time graph and I’m running into some issues / confusion.
If I tick the box for ‘Plot solar % instead of wm/2 on the solar real time graph (affects WDL)’ box, it doesn’t really seem to work. My Solar Real Time graph keeps reverting to wm/2 but shows percentage numbers. So I get a result that looks like it is still passing wm/2 but just placing a percent symbol on it? For example, I’m getting 850% which is what the wm/2 value is.
So I’m not sure if I’m doing something wrong or if this is a bug?
Also, regarding the ‘affects WDL’ - is it ok to have this option ticked/unticked when use with WDL? Does it mean that it also just feeds the different information to WDL?
I’m running 10.37s66 on a VP Pro2
that looks like a bug and yes to your other question
Tried the test version and now it reports 100.5% - so better, but maybe still a bit buggy?
Also if I try to reset the upper range on solar to less than 1500 it doesn’t persist through after the polling update. I tried setting the upper limit for solar to 200 and after the 60 second polling update, it reverts back to 1500.
Also, did something happen with the font settings in the test version? All my menu fonts got really big when I replaced with that .exe you linked?
Still having quite a few issue with solar plot. I’ve upgraded to 10.37Sb69 and I have the remaining issues
- [li]The percentage often still reads 100.5% at max
[/li]
- The yellow scale remains in wm2 and the graph occupies the very bottom of the range as it won’t stay set at anything less than 0-1500 range
