Coming back to this again… windy day.
Screenshot shows that the max wind gust today so far was 54 km/h but the main plot (and autoscale graph) both show 50 km/h. In parallel I record also customtextout file (1-second interval). Also this file does not contain the real max gust value.
The Davis’ console reports max gust 54 km/h (which is what WD shows in the left side of the screen).
The problem is: the real max gust value is not recorded in the log file and also not stored in the records min/max of the WD files.
Based on Brian’s short explanation, I think that WD indeed looks for the max gust that the Davis’ console stores but only displays this value in the main screen (left side). This value never gets to the log files neither to the plots.
I’m not bothered with the plots but am bothered the real max gust is not stored in the record values. WUnderground does keep all values correctly (?!)
I’ve bought a new laptop since I thought my older (slower) one was the problem… no luck
Running Win10, WD 10.37S58
I’d appreciate if Brian could take a look at the code and confirm my assumption.
Another question - what values are suggested under Control Panel → Offsets (Limits) ? I’ve had some values there (default, did not change them ever). What do they represent and how do these values affect the WD’s behaviour?
I see the same here on occasion…when I compare the highest recorded gust to what shows on the graph I find that sometimes the max gust speed is not shown. I never checked the logfile to confirm if it was recorded or not in the my data. I do know the graph will sometimes not show the max gust speed.
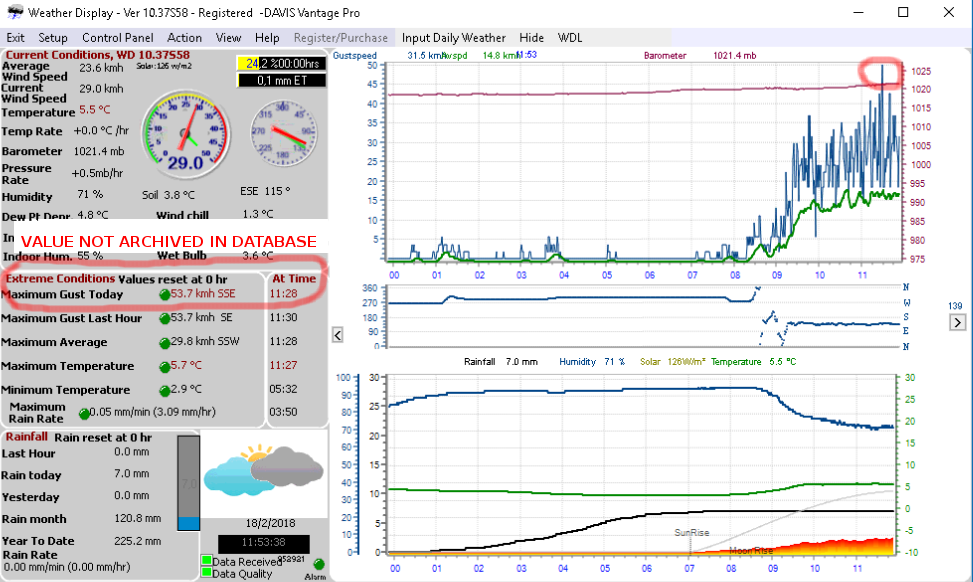
I’d really like to clarify this issue. I attached an edited screenshot where I marked the Max gust for the day value with a red circle. It reports “53.7 kmh SSE at 11:28” which is correct and correlates with the Davis Console.
The plot shows 49.9 km/h (small red circle on the upper right). And THAT value (49.9 km/h) is archived by WD. If you look at the monthly min/max values, it will say 49.9 km/h. From user point of view, this is not correct.
I understand WD looks 10 min back for the max gust speed, it displays it in the main screen but this is not archived as the max value. Station is Vantage Pro2.
Do I have some settings wrong? I have same setup (parameters) on another location with Vantage Vue and works reliably with no such issues. Gusts are higher there (up to 100 km/h).
Another question (asked already above): what do “Limits” parameters mean under Setup / Offsets, … ? How do they affect the behaviour?
Thank you Simnm, I’m relieved I’m not the only one seeing this. I guess the record values are kept in two locations hence the difference. It would be good to know the reason, though. I’m also wondering about those “Limits” settings, that prevent spikes in data.
When you talk about ‘’ Limits ‘’, you make me doubt that. In early February, I put low values in the ‘’ Limits ‘’ > Data Spike Ckeck Setup For Graph/Log Data . Because i wanted to import the weather link data, I had a lot of wrong data.
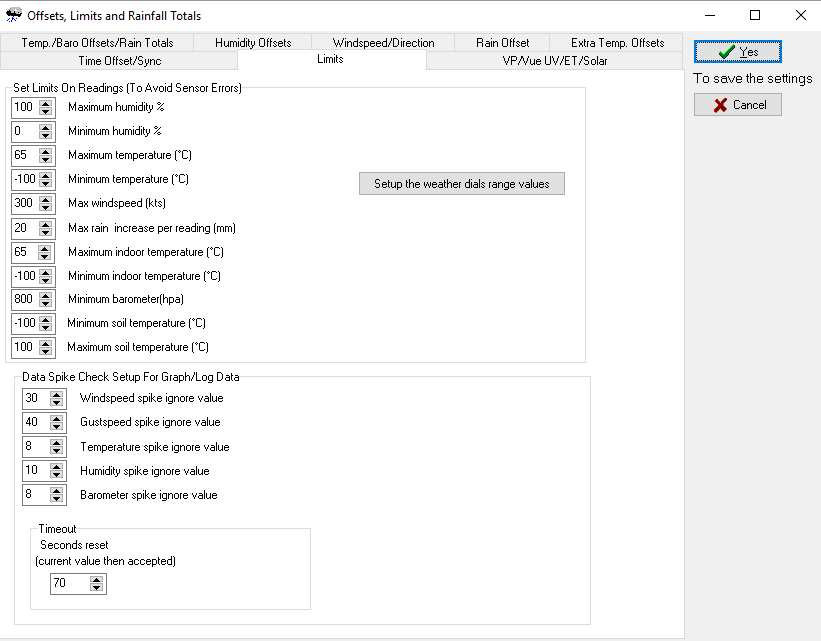
By default, the ‘’ Limits ‘’ > Data Spike Check Setup For Graph/Log Data are quite high. I put the default ‘’ Limits ‘’ picture below of Weather Display installed on another computer that served a few days.
The original Limits by default when installed Weather Display , data spike check setup graph/ log data wind speed skip ignore value ( 30 ), gust speed spike ignore value ( 40 ), temperature skipe ignore value ( 8 ),humidity spike ignore value ( 10 ) temperature spike ignore value ( 8 ).
Second pictures, the lower limits, like the 1 and 2, I have problems with that since.
Yesterday ( February 22 ), on main screen I have 27.8 km/h and today for February 22 in NOAA Report, I have 24.1 km/h.
Yesterday morning, I increased the values in the Limits of Data Spike Check Setup For Graph/Log Data. The maximum gust Yesterday on NOAA is 0.3 km/h lower than what I saw on the main screen. Good news. I will continue to check for the next few days.
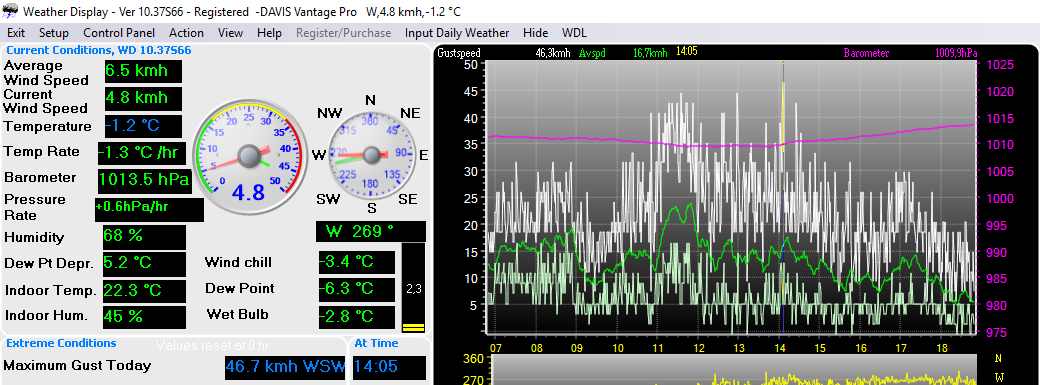
Look picture below for values ‘’ Data Spike Check Setup For Graph/Log Data ‘’ . The max gust speed yesterday is 46.6 km/h .
At the beginning of the month, I put 1 or 2 at the most. I had bad Maximum Gust on NOAA up to 5 km/h less than the real data on console or on main screen of WD.
I am guessing whether the laptop or the USB controller is unable to cope with the incoming data stream. I remember Brian’s information from the start from this thread:
I’m not sure this indeed works. Another use case was this night:
Max gust was 68.5 km/h (shown on Davis and reported in the WD’s main screen). I’m quite certain WD got this value from its periodical data check/compare from the Davis console as the value was not immediately shown in the WD.
The plot only showed a max gust of 61.5 km/h. The difference is 7 km/h which is more than 3 knots.
I suspect either the USB driver or WD not logging the data 100% (to correct files/locations).
For some this issue may seem irrelevant but assume that record 199 mph gust not be plot and its value not archived in the min/max records
‘’ mihec ‘’ I reread your message from .February 22, 2018. For today I have maximum gust speed of 46.7 km/h at 14:05 ( 2:05 pm ) at left on main screen . On graph I have 46.3 km/h at same time. Yesterday, I have 45.0 km/h maximum and graph 44.4 km/h. And the value on the graph, it’s the same in the NOAA report. It’s not a big difference, but it’s not the same value as the Console Davis.
Difference less than 2 kts will not be compensated (see Brian’s explanation).
I did notice something in my PC that could be wrong. Went through posts on this forum and came around one that discusses the Silicon Labs driver. Out of interest I checked the driver versions. Win10 version is different than Win7 version (I didn’t notice any issue on a WD running Win7). Looking at driver settings in the Control Panel, I noticed the Baud rate was set to 9600. WD is set to 19200. It’s weird how it worked so far?! Anyways, I have aligned the values to match (19200) and will keep an eye on the gusts. We have calm weather now.
I have installed the update of March 9 since three day. Yesterday, on main screen of WD I have 25.9 km/h at 4:00 pm . And NOAA Report , 24.1 km/h at 4:02 . The console is rounded to 26 km/h .