Hi ![]()
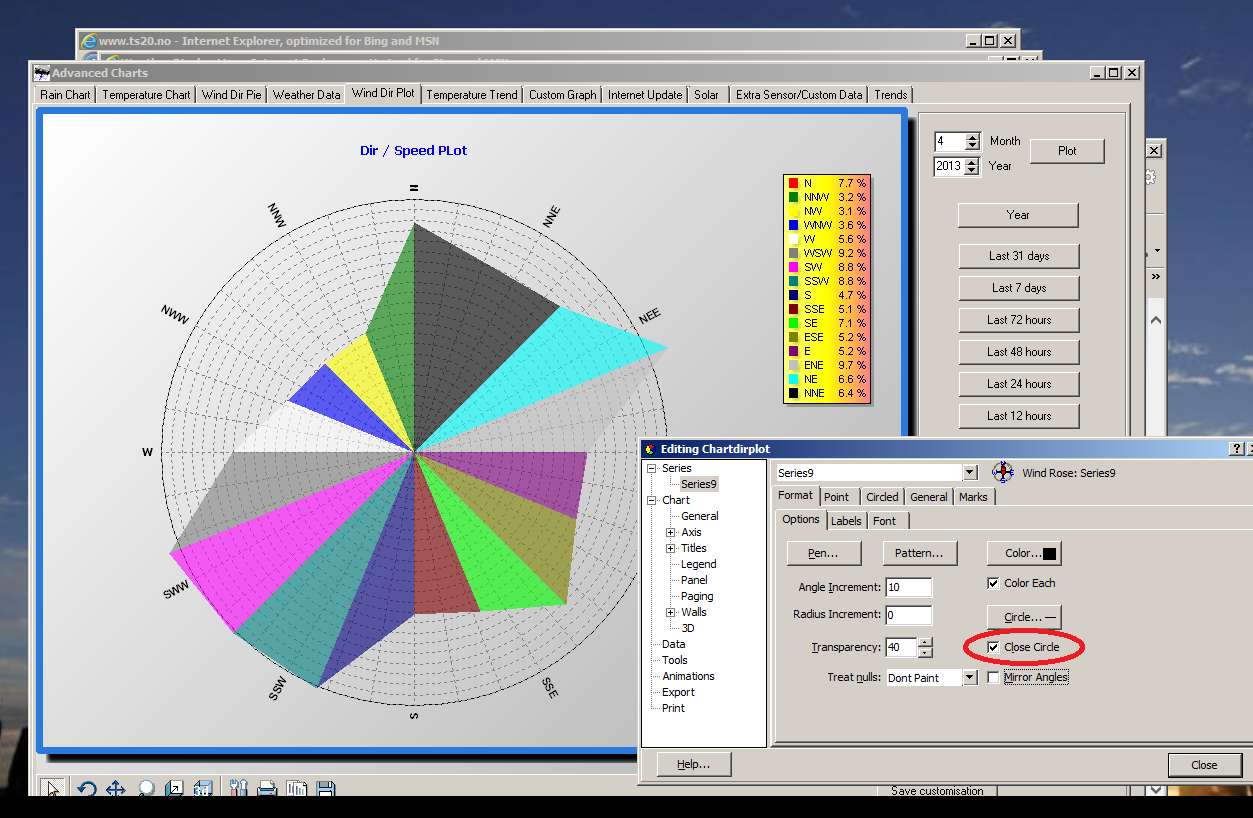
I played with different options in WD/WDL, and when looking into the Advanced Graphs, Dir/Speed Plot, it seems to me that the graph does not show all 16 different values for the directions, from N-NNW-NW etc…
The legend has 16 values, but the graph is showing just 15 of them, missing the value for North.
In the attached picture the value for North should have been red, but it is black. The value for North is missing and is just filled up, by ticking the “close circle” option. May be it is black since the NNE-value is black.
Other have the same problem in this graph: Wind Direction / Wind Distribution - Weather Display Feature Suggestions - Weather-Watch.com