1.- I like gray pointers, but not on the rainfall one. I don’t want a gradient colour pointer. Is there a way to change the pointer colour to a single more readable one just for this gauge?
2.- I want to use the upper LED strip to show some forecast text. How to do it?
3.- I’ve set up “ledVisible true”. Some of them blinks, some others don’t. What’s the meaning of this gauge led?
4.- Is three a way to make te max daily value bug a bit bigger? Maybe a colour change?
5.- On baro and solar radiation gauges I see some red sectors at the begining and end of scale. What does they mean?
Thank you very much. Btw: I have almost ready a complete spanish translation, let me know if it can be included in the package for next script versions.
You can overide the pointer colour on each gauge, in the drawRain() function, just provide a parameter “pointerColor: ,”.
Not quite sure what you mean - it does display forecast text?
It blinks if the current gauge value is above the ‘thresholdValue’, by default the threshold value is set to 50% of the gauge scale.
Not sure what you mean here.
On the baro gauge, the red sectors show your all time low and high pressure record values. So the scale between the red sectors shows pressure values you have already experienced at some time. On the Solar gauge, the red sector starts at the current theoretical max value, and just extends an arbitary range because shading the whole gauge doesn’t look too good!
Thank you very much. Btw: I have almost ready a complete spanish translation, let me know if it can be included in the package for next script versions.
[/quote]
Just send it to me and I’ll include it - thought the Spanish translation was pretty complete already though?
It blinks if the current gauge value is above the 'thresholdValue', by default the threshold value is set to 50% of the gauge scale.
Ok, is that threshold user settable?
Not sure what you mean here.
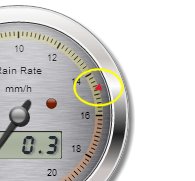
I mean the red bug on the scale showing max value reached. See attached image below.
On the baro gauge, the red sectors show your all time low and high pressure record values. So the scale between the red sectors shows pressure values you have already experienced at some time. On the Solar gauge, the red sector starts at the current theoretical max value, and just extends an arbitary range because shading the whole gauge doesn't look too good!
Ok, understood. Where can I modify their colour or transparency? Found this.
Just send it to me and I'll include it - thought the Spanish translation was pretty complete already though?
No, not at all, many strings were not translated yet. I’ll send to you when ready, thanks !!
Hi niko, it’s been a long time, nice to meet you all here
You’re right, I’m testing with an old Davis WMII, it doesn’t generate the %vpforecasttext% tag. Anyway I see now how to show the message I want. But… I have my download counter set to 5 seconds and that’s not enough time to show the whole message. Is it possible to change the refresh time just for this LCD status display?
Mark, thanks a lot for your help. Just one question: I’ve seen a cool extra gauge, an altimeter, perfect to show density altitude on a flying club webpage Is it possible?
The altimeter is not included in the steelseries library I provide with the gauges - all the ‘extras’ are removed to reduce the file size. So, you will have to download the full version of the library from Github.
Using it is pretty straight forward - there are not many options, take a look the demoExtras page, the JavaScript to create and set the value is embedded in the page.
It draws the status displays and the gauge, but no update is performed. Note that customclientraw is read in both cases (forecast tag at least, it’s the same in both pages). Why it does not init the counter?
But most of the gauges are missing from your HTML? The script errors when it tries to write to each missing gauge.
I have not put error handling in the script to cope with this eventuality, the script is getting large enough as it is without catering for every possible failure.
If you only want the temperature gauge, then you will have to remove all the calls to drawXXX() and doXXX() that refer to the missing gauges.
Well, you can, but you will need two versions of the gauges.js script - or you leave the all gauges in your single gauge page but hide them using css - not a nice solution really.
Or you make to two tabs different ‘views’ of the same page and dynamically hide/show the other gauges.
Ok, we crossed messages… Two copies of the script sounds a bit redundant and computer consuming. Have to explore the last option, not sure how to do it.