Hi,
Any who knows how to set that glassy effect in foreground off?
Its don’t look so good when dark background…
Henkka
Hi,
Any who knows how to set that glassy effect in foreground off?
Its don’t look so good when dark background…
Henkka
In ‘gauges.js’ you’ll find ‘//Gauge look’n’feel settings’ where you can set the foreground type:
var g_foreground = steelseries.ForegroundType.TYPE1;
I think types 1 through 4 are available. You might be able to select one more to your liking, but I make no promises.
Yes, i know but no of them set it off…
If i disable the foreground totally (its possible, but not trought the settings shown in that list) i also loose the knob.
Another q:
henkka
Changed the title…
Third question…
How do the now colorized sections in scale gradient? ![]()
Then a bug:
It calls humidity_1hr.php at every ajax-load even if not shown, and even worse, ALL the graphs at initial load, why?
Thats a waste of resourses and may users may get complainments from webhosts about it as, as well known, php-gd-graphs are not the most lightweight ones, and when loaded every 5 secs or so they will show up high in their logs. Those should be loaded only if requested.
Henkka
Not without modifying the SteelSeries library, you will have to create your own custom version of the library.
Again you will have to create a custom SS library.
They are defined in gauges.js, which gauge?
They should only reload by default every 15 minutes. If they reload every refresh then something is wrong. My copy of the script does not do this.
The graphs are downloaded in the background after the page first displays as that the popups work straight away, other wise the popup contains a missing graphic when you first mouseover each gauge and there is a noticeable delay whilst it it fetched from the server.
Not without modifying the SteelSeries library, you will have to create your own custom version of the library. Again you will have to create a custom SS library.Quite difficult when no documentation about the libary....
They are defined in gauges.js, which gauge?Normal radial (needle-gauge)
The graphs are downloaded in the background after the page first displays as that the popups work straight away, other wise the popup contains a missing graphic when you first mouseover each gauge and there is a noticeable delay whilst it it fetched from the server.They should at leat be loaded "behind the sceenes" one-by-one with little timeout between each or when visitors loads it, wich happens first, not all at once to avoid angry webhosts. And at least they should be cached/saved. Soon as someone gets little more visitors on its page rises the risk to get complainments from the hosts and as result maybe kicked out (just think scenario when 20 vistors comes to the page at same time, then it creates almost 200 graphs at once).
The hosts seems allready to complain about the many and fast FTP’s our wx-sites uses and also about the fast-requested datafiles like clientraw.txt and such files so one more “complaining-thing” can get their cans to bring over and should been avoided, at least, like in this case, when its possible to do it. Seen that with many pages allready (thats why i and a dozen others wx-sites nowdays lives on own dedicated server and others uses VPS’es)…
EDIT: My point are not to be silly, its pure from serverside of the view, what more bells and whistles we use that more important is it to take serverside of the system and what loads etc. it cause to it in act too to avoid problems ![]()
They should only reload by default every 15 minutes. If they reload every refresh then something is wrong.Don't know what there are wrong (i use for my own scripts jQuery's own ajax instead of a homebrew one). Testpage here: http://www.nordicweather.net/gauges-ss_v1-6-5/gauges-ssT.htm
Henkka
As to loading the graphs in the background, I’m not sure preloading should be default. Certainly if they are preloaded as Henkka says they should be done with a small delay between them, and this preload should be an option. I’m in favour of loading the graphs on demand with a message displaying saying the graph is being loaded which is replaced when the graph is available, that way only the viewed graphs are fetched.
These gauges are going to be used in place of or in addition to WDL and one big difference between them is the graphs, WDL builds the graphs in the browser from the data in the clientraw set but these gauges load them from the server so this increases the bandwidth used and for some folks this is going to be a problem especially if you have a heavily used site.
Stuart
Henkka, I see the problem, it is just the humidity graph that is getting downloaded each update.
The problem is line 1438 in your script
if (g_showPopupDataGraphs && g_tipImgs[4][0] !== null) {
should read
if (g_refreshGraphs && g_showPopupDataGraphs && g_tipImgs[4][0] !== null) {
Hmm, I don’t know when this error crept in, it wasn’t like that before #-o
Ok, thanks.
Btw, as tip, have you had toughts about doing the steelseries.js to modular so only needed parts are loaded, like jQuery Ui are done where its possible to have only wanted modules included? As now the full steelseries are 660 KB uminimized (WOW! what an inscreadible amount of code with 14K lines! 8O :lol:). Should speed up the generation of gauges on slower browsers for sure if not all the stuffs are loaded/readed. ![]()
Henkka
The library needs quite a bit of work, modularisation is still on the to-do list (it brings its own issues around unsealing/sealing the class when including additional modules, or making private stuff public - JavaScript really isn’t designed to support modular classes), as is removing some redundant code, futher optimisations, rescaling everything so it can go ‘frameless’ at full scale… etc. So much to do and too little time ![]()
The library needs quite a bit of work, modularisation is still on the to-do list (it brings its own issues around unsealing/sealing the class when including additional modules, or making private stuff public - JavaScript really isn't designed to support modular classes), as is removing some redundant code, futher optimisations, rescaling everything so it can go 'frameless' at full scale... etc. So much to do and too little time
Thats soo true, too much to do and too little time :lol:
For modulation/plugins take a look how jQuery and jQuery-UI are done. In UI, what fullsized are in same sizecategory as steelseries, are they providing one full script but also every component separate so its possible to build a custom file only with components needed. ![]()
Few suggestions for future releases:
![]()
Henkka
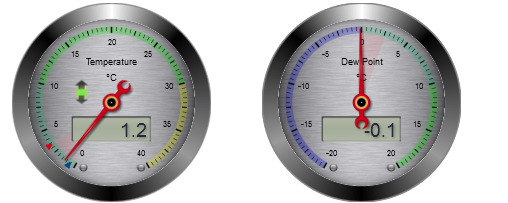
Another suggestion, scales of temperature and dew/etc-gauge should allways be the same, looks little funny and may be confusing if do a quick look when different scales, see attachment
Henkka
That would be better, but coding it is a little tricky with the switch-able value options, and it would have to be ignored for the ‘indoor’ values.
The whole ‘auto-ranging’ of the scales is quite primitive to be honest. I picked quite large ‘jumps’ in scale, all the values may not fit with a single range. In order to implement this I think I may/would have to reduce the scale ‘jumps’. Any brilliant ideas welcome.
I think they should not jumping around so much at all, as peoples may look at just the direction where needle points when do quick looks. Therefore should “main scale” allways be the same and autoscaling jumps in only in extreme situations, and then with jumps of say 10C at time, as max.
One idea could be to have user-configurable “base-scale” say max +30C, min -20C, (ie range of 50C, or whatever is the best range) and only when values goes outside that jumps autoscaling in.
Henkka
I think a user set range is probably a good way to go since my location is unlikely to see anything below -10 and above 35
Yes, I’ll look into implementing this type of functionality.