I have an Intel Atom D510 PC with 4GB RAM that I built specifically for my WxPC and is on 24/7 and runs Windows7 64bit, it only runs this OS and WD (currently 10.37Qb78) nothing else.
The problem I have is that it runs out of memory on day-6. This is very consistent and has happened with whichever version of WD has been installed (releases over the last 18-months approx). This problem also seems related to corrupt wind data as posted in my thread http://discourse.weather-watch.com/t/51147 as it happens only when the memory is getting low.
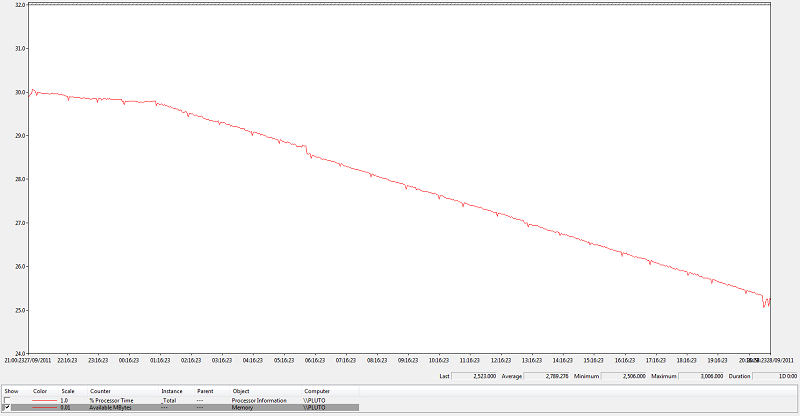
I don’t really want to reboot the machine periodically as this doesn’t fix the issue so I have setup the Win7 Performance Monitor to trace free memory over a 24hr period, the results are attached (see photos):
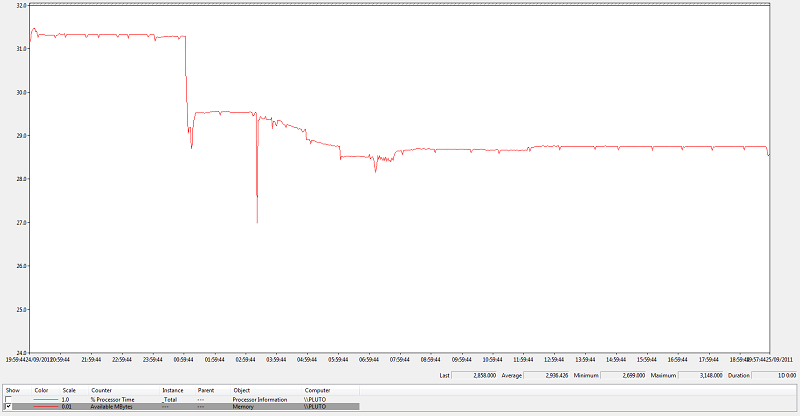
Graph1 = PC boot with WD not running over 24hrs
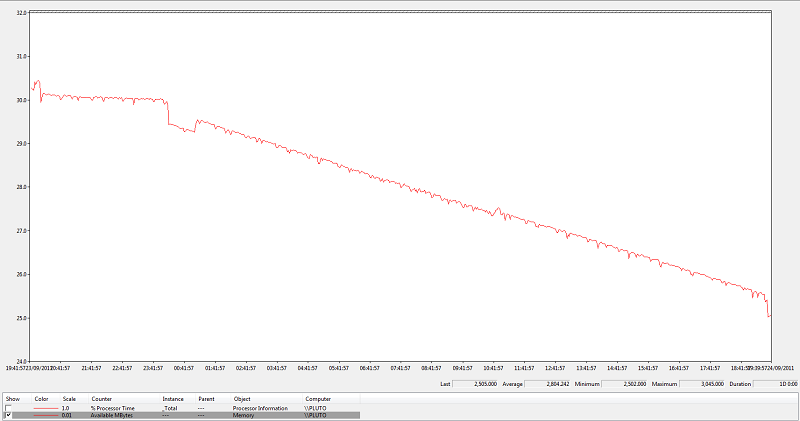
Graph2 = PC boot with WD running from startup over 24hrs
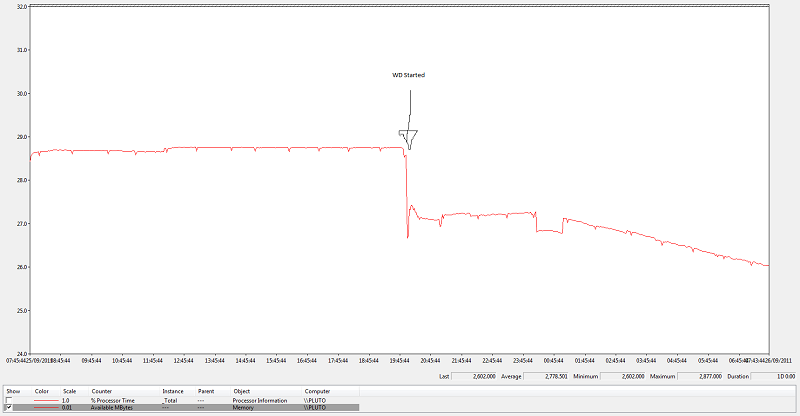
Graph3 = WD notrunning for 12hrs then WD started and left for 12hrs
It seems to me that WD is causing memory to be used and not returned to the OS, I don’t know why or what is causing this at this stage hence hoping for some help from you guys. What I do know is that if I look at the Task Manager there are no processes that are consuming unexpected memory. Also I am guessing this problem might be specific to me or maybe not many people are running WD on Win7 64b.
So if anyone has any ideas on what it is or what I could do to investigate this issue it would be much appreciated as I no longer want to reboot this machine every week #-o
Why not have WD restart itself periodically instead of restarting windows. You can do that through WD by going to the FTP & Connections button in the control panel, choose remote control/reboot, and then set a time - every 14 hours, or specific day/days and time, make sure the “reboot” switch is on (green) and make sure to check the option below that switch that tells WD to restart itself rather than rebooting windows.
It seems to be something associated with the 00:00 Day reset and daily totals calcs at 00:08 which run and the stop but from the return of that routine it always seems to consume extra memory after that function.
that midnight reset is a good clue
try as a test turning off the av/ext updates
(in the ftp/internet setup,upload times and under view, av/ext , internet tab)
Thanks for the suggestion jbrooks987 but it wouldn’t help in my situation because the memory is being leaked i.e. not being restored to the OS i.e. lost until the OS is rebooted.
Agreed but I think Graph2 shows something more problematic as the memory is being depleted in a linear fashion over time.
Are there any other Win7 64bit users as I would be interested in there memory usage.
Do you remember we have been struggeling with Christians crashes? I have been meaning to write you for some weeks now - but havent done till now. The crashes still continues at Christians computer and its everytime at midnight roll-over (00:08)
We did solve the problem at my wx-computer.
We have been setting Christians computer excactly up the same way as mine - and we have the excact same programs etc. running - the only difference is that Im running Windows 7 Home Premium 64-bit and Christian is running Windows 7 Ultimate 32-bit.
Yeah that is a good point.
I have made those changes to the Avg/Ext upload settings, restarted the PC and its Performance Monitor and I will report back tomorrow with the results.
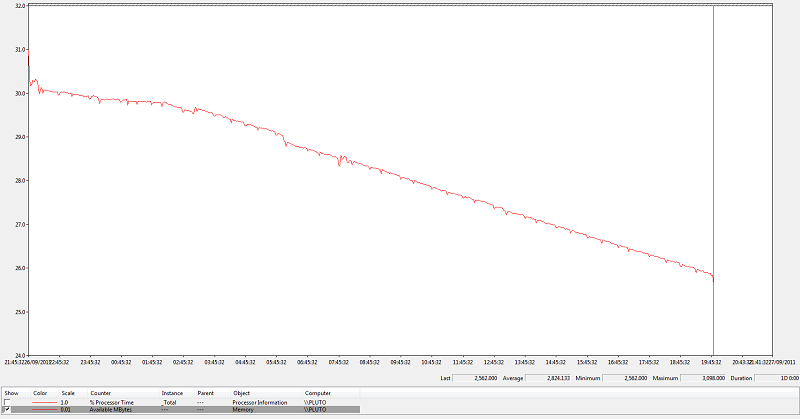
Attached (Graph4) are the results from the last 23hrs where Avg/Ext uploads were disabled.
Unfortunately this hasn’t made any difference with the results as the memory loss is still evident and it looks approximately the same rate of change from a visual analysis.
Thanks Brian I will set this up for the next 24hrs and report back.
Here are the results in Graph5 attached - it seems that the memory loss remains at the same rate (approx 25MB/hr) but whats interesting is that the memory trace is a not as choppy i.e. memory consumed and relinquished is smaller.
In Windows7:
Search for the ‘Performance Monitor’, and start it up
Under the ‘Monitoring Tools’ select ’ Performance Monitor’
You will get a graph plotting ‘Processing Time’ by default, right click in the graph and select ‘Add Counters’ and then you will be given a huge list of parameters that you can trace, select one or many and tweak the vertical range, sampling frequency, period etc for what you want to trace.
To trace free MBytes over 24hrs I use: Parameter magnitude = x 0.01; Vertical scale = 24 to 32 (i.e. 2.4GB to 3.2 GB); Duration = 86400s; Sample frequency = 120s; graph set to scroll
thanks for those detailed instructions, I have set that up on my PC now too
it looks like to me from your graph that the memory starts to decline after a certain amount of running time, and so is not related to the av/ext midnight updates
i.e depends on when the pc is restarted
not a memory leak as such, at least not that I could see from just checking with task manager, but on my HP Mini (Intel Atom), W7, after 6 days running I would get strange things happening requiring a reboot
I did discover that some of the HP tools/program running had memory leaks , and so I disabled/removed those
and yet on another setup I have WD running, W7, but a desktop, it runs for weeks with no problems
I am currently graphing available memory (there was no free memory to choose from), using performance monitor, as per your post abovem and its stable (for my setup above)
I have installed the latest test build you have kindly provided and re-started tracing memory over a 24hr period, so far it looks good but its only been up for just over an hour.
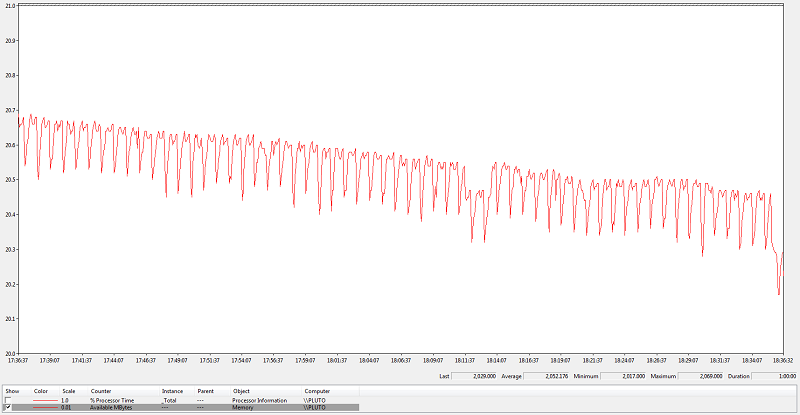
Yesterday evening (previous test build) I captured a trace over a 1hr period (see Graph6 attached) which is interesting. The frequent troths are on the minute rollover, and you can see the consistent and gradual degradation of memory.
The results from your latest test build are the same as my previous memory traces unfortunately i.e. about 3-4hrs where it starts off good and then falls off in a linear fashion.
It has to be something else on my Windows setup. I am wondering if it could be the Intel graphics driver or something similar that when WD is running and calling it influences the memory loss. Perhaps I could trace something more specific like that. This is a tricky one and I am not sure where to go next with it.