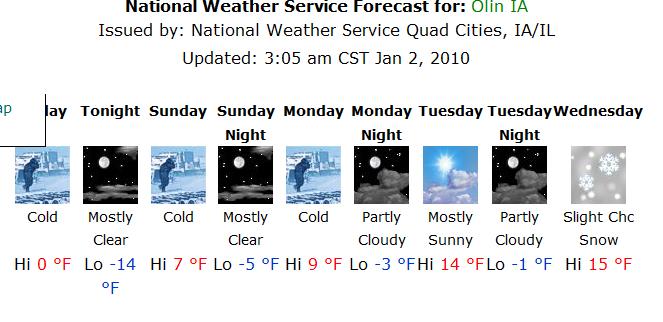
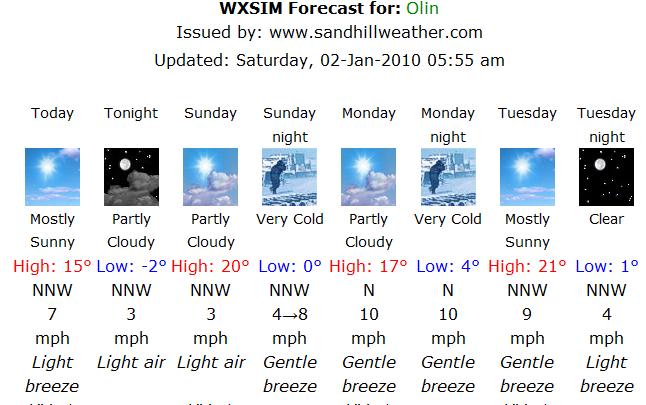
For some reason my temps are well above the NWS. Don’t understand why though. Here is my compare page to show the differences. Have not messed with anything within wxsim.
http://www.chucksweather.com/wxcompareforecast.php
Chuck
For some reason my temps are well above the NWS. Don’t understand why though. Here is my compare page to show the differences. Have not messed with anything within wxsim.
http://www.chucksweather.com/wxcompareforecast.php
Chuck
Chuck I noticed just today mine is doing the same 10-15 degrees to high. I rebooted Wxsim and waiting for a auto run
Brad
Edit: Last run was much closer but still a bit warm compared to NWS
I have been having the same issue… temps as of late are going too high.
Its a shame i cant “tone it down”
Heres my forecast this morning Wxsim I wish Wxsim was right but the NWS is right on the mark
Brad
I am not running latest version tho 12.6.1 I think I am on
Hmmm… here in Atlanta, WXSIM has been forecasting colder than the NWS for the last few days (looking out into the coming week): lows in the mid teens and highs in the mid 30’s, versus NWS saying about 20 and 40. One thing to check: make sure you are entering (manually, as there’s no way to import this) accurate snow cover information (lower right part of the main form). Any value you enter should remain as the default until you change it, so make sure to update it every couple of days or so (obviously more often if it changes a lot!). Note that there’s also a difference between powdery and sluchy stuff, and you can make that distinction on the form.
Let me know if that helps!
Tom
adding the snow depth took care of 1/2 my difference still 7-8 degrees to hot compared to NWS But right now we are warmer then NWS so I will see who is closer at the end of the day
Brad
I just updated my snow cover to 6 inches. I will see what happens.
Chuck
Just bumpng this
My daytime highs are still forecasting 8-12 degrees to warm but overnight lows are right on
I have entered snowfall on ground
Brad
Hi Lee,
I just examined those forecast comparisons you posted. There’s definitely something wrong with some setting, because those lows (especially) are way too high, and in a weather regime that WXSIM is usually pretty much an “expert” on! Here, WXSIM caught on to the degree of cold of this outbreak well before the NWS did, and only after the NWS started using persistence did they about match. The auto runs the last 2-3 days were a bit too warm (about 2-3 degrees) but some of that was because I wasn’t there (the computer is up at school) to put out 1/2 to 3/4 inch snow cover in there, which would have made up at least half the difference.
Could you post a screen shot of your auto run settings? Also, have you tried manual runs?
I may try a forecast for you in a minute …
Tom
Lee,
Here’s a forecast I just made. I imported HSV’s METAR, and used auto run, with pretty standard settings. I made the average temperature the last 4 days 25 degrees. That’s something that makes just a small (degree or two) difference, and which would be imported with your local data for the calibration run).
Summary (min and max values):
Jan 10* 18 23 11:58 P 8:53 P 12 13 62 75 97 97 0 2 6:54 A 4:55 P
Jan 11 14 43 6:58 A 2:58 P 11 20 35 82 61 97 2 12 6:54 A 4:56 P
Jan 12 21 34 11:58 P 3:23 P 18 20 53 83 33 97 3 10 6:54 A 4:56 P
Jan 13 16 48 7:03 A 2:43 P 16 19 31 97 79 97 0 3 6:54 A 4:57 P
Jan 14 24 55 6:58 A 2:38 P 19 26 31 81 62 94 0 4 6:53 A 4:58 P
Jan 10* 20.9 12.4 69 2.0 1.0 297 0 0 0 1 0.00 0.0
Jan 11 28.4 15.1 60 6.6 6.4 243 32 91 3170 2 0.00 0.0
Jan 12 28.1 19.0 69 7.5 7.1 321 63 15 1459 13 0.00 0.0
Jan 13 30.2 17.9 65 1.7 0.9 358 1 100 3290 1 0.00 0.0
Jan 14 38.0 22.3 57 2.1 2.1 180 83 100 2666 1 0.00 0.0
Nighttime lows and daytime highs:
Sun Mon Tue Wed Thu
Jan 10 Jan 11 Jan 12 Jan 13 Jan 14
|M M|14 43|25 34|16 48|24 55|
Totals ( 4 complete days ) :
AV MIN AV MAX AV DP AV RH AV WS RES WS RES WD AV SC %SUN AV PR AV SD
18.7 45.1 18.6 62 4.5 2.6 278 45 77 0.00 0.0
WXSIM text forecast for Madison, initialized at 8:53 PM Jan 10, 2010
Tonight: Clear in the evening, becoming clear except for a few wispy clouds
after midnight. Low 14. Wind west-northwest around 3 mph in the evening,
becoming west-southwest after midnight.
Monday: Mostly sunny. High 43. Wind west-southwest around 9 mph.
Monday night: Partly cloudy in the evening, becoming mostly cloudy to cloudy
after midnight. Low 25. Wind chill down to 17. Wind west-southwest around 6 mph
in the evening, becoming northwest after midnight.
Tuesday: Cloudy in the morning, becoming partly to mostly cloudy in the
afternoon. High 34. Wind northwest around 9 mph.
Tuesday night: Mostly clear in the evening, becoming clear after midnight. Low
16. Wind north around 4 mph.
Wednesday: Sunny. High 48. Wind north-northeast around 2 mph in the morning,
becoming west in the afternoon.
Wednesday night: Clear in the evening, becoming partly cloudy after midnight.
Low 24. Wind south near calm.
Tom,
Here’s my data.
Summary (min and max values):
Jan 10* 15 18 10:55 P 8:55 P 12 13 81 89 81 94 0 1 6:54 A 4:55 P
Jan 11 15 45 3:55 A 2:55 P 13 22 32 89 69 93 1 10 6:54 A 4:56 P
Jan 12 24 40 11:55 P 2:55 P 19 22 45 80 32 95 3 8 6:54 A 4:56 P
Jan 13 19 53 7:05 A 2:35 P 16 20 27 86 92 95 0 3 6:54 A 4:57 P
Jan 14 25 56 1:25 A 2:25 P 19 26 29 79 61 92 0 4 6:53 A 4:58 P
Jan 15 28 54 6:55 A 1:35 P 26 38 40 90 11 79 3 14 6:53 A 4:59 P
Jan 16 40 52 12:05 A 1:25 P 38 49 88 98 10 43 5 23 6:53 A 5:00 P
Jan 17 35 44 8:55 P 12:05 A 34 43 85 100 18 31 9 15 6:52 A 5:01 P
Jan 10* 16.5 13.0 86 0.3 0.2 257 15 0 0 1 0.00 0.0
Jan 11 29.7 16.4 62 5.4 5.1 248 39 85 3065 2 0.00 0.0
Jan 12 31.7 20.8 65 6.2 5.9 336 56 29 2037 9 0.00 0.0
Jan 13 33.3 18.4 59 1.8 0.8 342 1 100 3252 1 0.00 0.0
Jan 14 38.0 22.7 58 2.3 2.3 180 85 100 2629 1 0.00 0.0
Jan 15 40.7 28.7 65 6.5 6.1 113 96 50 1863 63 0.17 0.0
Jan 16 46.3 44.6 94 13.7 6.2 121 98 3 617 92 0.82 0.0
Jan 17 40.2 38.5 93 12.2 11.5 260 100 0 859 46 0.06 0.0
Nighttime lows and daytime highs:
Sun Mon Tue Wed Thu Fri Sat Sun
Jan 10 Jan 11 Jan 12 Jan 13 Jan 14 Jan 15 Jan 16 Jan 17
|M M|15 45|27 40|19 53|25 56|28 54|40 52|39 42|
Totals ( 7 complete days ) :
AV MIN AV MAX AV DP AV RH AV WS RES WS RES WD AV SC %SUN AV PR AV SD
26.7 49.2 27.2 71 6.9 1.4 235 68 52 0.15 0.0
Today I disabled Recent Temps and Recent Precip.
Hi Lee,
Generally, I would say to keep recent temps and precipitation, as they tend to help. Possibly, however, there may be some usints setting somewhere leading them to cause a problem. Have you looked at the imported recent temps and precip during a manual run, to make sure they looked about right? Crazy values of these could indeed mess up a forecast. Otherwise, they are worth keeping.
By the way, I tried to post an extensive post a while ago, and it doesn’t seem to have shown up (after I spent 10-15 minutes putting it together!) ![]()
What it showed was my recent forecasts. They were all very much in line with actuals, and generally were beating the NWS (at least the ones I made manually were). The manual forecasts had essentially no net error on the highs or the lows. The auto ones were a couple of degrees too warm, but I think that’s because they didn’t have the snow cover in them.
Tom
Lee,
Another thing - it would be better NOT to use GFS for initial advection. METAR data is real, and the GFS is modeled and may be a bit off.
Those low temperatures were just way, way off, definitely indicating something wrong (other than a customization problem). I would very much like to know what it is. Essentially, you should get the same forecast I do, if we’re using the same data.
If you keep seeing significant errors (especially with a particular bias), I’d be interested to communicate further to track it down. I don’t want you or other people having errors like this when it could be a simple fix!
Thanks,
Tom
Thanks Tom.
Strange thing, seems more accurate last week, after the rain. The recent precip screen shows very-damp. It’s been 8 days.
Manual run had one pop-up that MOS ran out. I switched to neutral adv, then back to regional to get past it.
Below are the other import screens.
Thanks Tom.
Summary (min and max values):
Jan 10* 19 20 11:33 P 9:53 P 13 14 73 78 94 94 1 4 6:54 A 4:55 P
Jan 11 19 44 12:03 A 2:53 P 14 21 32 79 69 94 1 10 6:54 A 4:56 P
Jan 12 29 39 11:53 P 2:43 P 19 24 48 75 32 96 4 8 6:54 A 4:56 P
Jan 13 25 53 7:03 A 2:33 P 20 23 28 77 92 95 0 4 6:54 A 4:57 P
Jan 14 29 54 6:53 A 2:33 P 23 27 32 74 61 92 1 4 6:53 A 4:58 P
Jan 15 29 52 6:33 A 1:33 P 26 40 41 90 11 79 3 14 6:53 A 4:59 P
Jan 16 41 55 3:03 A 10:23 A 40 52 88 100 9 34 5 23 6:53 A 5:00 P
Jan 17 37 46 9:53 P 12:03 A 37 45 91 100 18 28 9 15 6:52 A 5:01 P
Jan 10* 19.8 13.4 76 1.7 1.7 260 9 0 0 1 0.00 0.0
Jan 11 31.3 16.0 56 5.5 5.4 262 39 85 3069 2 0.00 0.0
Jan 12 33.3 21.5 62 6.3 6.0 323 56 28 2042 9 0.00 0.0
Jan 13 37.3 21.2 55 2.0 1.0 358 1 100 3246 1 0.00 0.0
Jan 14 40.1 24.2 55 2.6 2.6 180 85 100 2628 1 0.00 0.0
Jan 15 42.0 29.8 64 6.8 6.3 113 96 50 1858 62 0.17 0.0
Jan 16 47.4 46.3 96 13.7 6.2 121 98 2 569 93 0.82 0.0
Jan 17 42.3 41.3 96 12.1 11.3 262 100 0 836 46 0.06 0.0
Nighttime lows and daytime highs:
Sun Mon Tue Wed Thu Fri Sat Sun
Jan 10 Jan 11 Jan 12 Jan 13 Jan 14 Jan 15 Jan 16 Jan 17
|M M|19 44|29 39|25 53|29 54|29 52|41 55|42 44|
Totals ( 7 complete days ) :
AV MIN AV MAX AV DP AV RH AV WS RES WS RES WD AV SC %SUN AV PR AV SD
29.8 49.0 28.6 69 7.0 1.5 241 68 52 0.15 0.0
and
I unchecked GFS for init adv.
Jan 10* 15 18 10:55 P 8:55 P 12 13 81 89 81 94 0 1 6:54 A 4:55 P
Jan 11 15 45 3:55 A 2:55 P 13 22 32 89 69 93 1 10 6:54 A 4:56 P
Jan 12 24 40 11:55 P 2:55 P 19 22 45 80 32 95 3 8 6:54 A 4:56 P
Jan 13 19 53 7:05 A 2:35 P 16 20 27 86 92 95 0 3 6:54 A 4:57 P
Jan 14 25 56 1:25 A 2:25 P 19 26 29 79 61 92 0 4 6:53 A 4:58 P
Jan 15 28 54 6:55 A 1:35 P 26 38 40 90 11 79 3 14 6:53 A 4:59 P
Jan 16 40 52 12:05 A 1:25 P 38 49 88 98 10 43 5 23 6:53 A 5:00 P
Jan 17 35 44 8:55 P 12:05 A 34 43 85 100 18 31 9 15 6:52 A 5:01 P
Jan 10* 16.5 13.0 86 0.3 0.2 257 15 0 0 1 0.00 0.0
Jan 11 29.7 16.4 62 5.4 5.1 248 39 85 3065 2 0.00 0.0
Jan 12 31.7 20.8 65 6.2 5.9 336 56 29 2037 9 0.00 0.0
Jan 13 33.3 18.4 59 1.8 0.8 342 1 100 3252 1 0.00 0.0
Jan 14 38.0 22.7 58 2.3 2.3 180 85 100 2629 1 0.00 0.0
Jan 15 40.7 28.7 65 6.5 6.1 113 96 50 1863 63 0.17 0.0
Jan 16 46.3 44.6 94 13.7 6.2 121 98 3 617 92 0.82 0.0
Jan 17 40.2 38.5 93 12.2 11.5 260 100 0 859 46 0.06 0.0
Nighttime lows and daytime highs:
Sun Mon Tue Wed Thu Fri Sat Sun
Jan 10 Jan 11 Jan 12 Jan 13 Jan 14 Jan 15 Jan 16 Jan 17
|M M|15 45|27 40|19 53|25 56|28 54|40 52|39 42|
Totals ( 7 complete days ) :
AV MIN AV MAX AV DP AV RH AV WS RES WS RES WD AV SC %SUN AV PR AV SD
26.7 49.2 27.2 71 6.9 1.4 235 68 52 0.15 0.0