I’m having problems with spikes showing up in my temperature graph. The spikes mins and maxes are also being recorded in WD for my daily, monthly, yearly averages and extremes etc. I never used to have this problem, then it started happening occasionally, and now I am having frequent problems with this. It some times (but not always) seems to fix it when I reboot the system. So I think it’s got something to do with the computer or software, and not the station it’s self. I am using the computer for some other things too such as running a web browser, email and dreamweaver etc. I am running WD version 10.37N. Has anyone got any ideas?
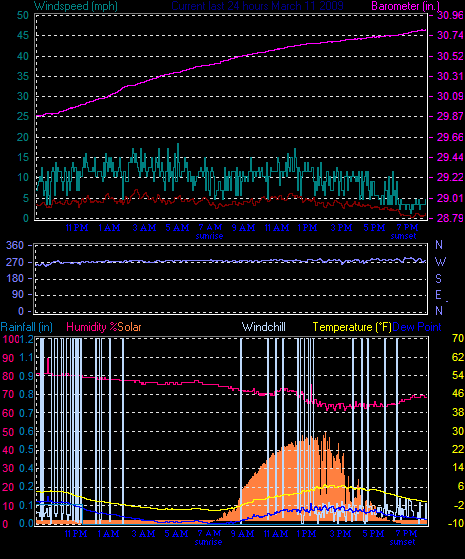
This image shows the spikes in the graph and the resulting incorrect min/max temperatures.
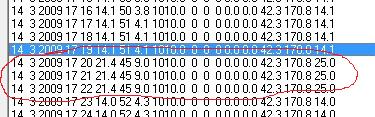
Really has no one else had this problem? I’m seeing what seems to be causing the problem in the log files. When a spike appears, a “0” is put infront of the temperature as in the following spike example;
Yes, I’ve seen that many many times in mine but never associated it with spikes on the graph, I’ll have to go back and look. I’ve just been fixing it when I see them!
Just checked my graphs today and I have a huge grouping of Heat index of 5305.2F when the outdoor temperature was about 3F. Now thats a Heat Index!!
Looking at the log files, I don’t see any of that, everything looks normal. Any ideas on how to recreate the last 24 hours graphs? Maybe that will get rid of it?
a 0 in front of a number in the logfile is not a problem
its the same value as if the 0 was not there
its just a formating issue when it goes from 9 to 10
its not a data spike, and will not be coinciding with the data spikes
the data spikes you see will be unique to the WH1081 station
you could try clearing out the memory buffer on the station
Thanks for all the replies! I think it was just coincidence that the spike was around the same time as the leading “0” thing. I am seeing spikes else where with real values in the logs. I think you might be right Windy, about it being the station. I’ve reset the memory now so I’ll see how that goes.
As Niko says, it defaults to auto-adjust but that can be overridden with manual settings. And I don’t know if it will adjust auto for anything besides rain and air temp and baro. I know I have had to adjust mine for dewpoint in the past…
I think you are correct, I did find the section that lets me manually change it, that cleared it out. Perhaps this is something that Brian can add into the auto scale? It wouldn’t be much of an issue except for the fact that it does export the graphs that way as well.
Hi,
I’ve got similar spikes very sometimes with a WMR200, they usually happen after I had the computer off for a while and restart it (that’s just an observation but it might have nothing to do with it).
Rgrds