That was it! I had that problem also #-o so that’s your answer.
I see you have it working now ![]()
That was it! I had that problem also #-o so that’s your answer.
I see you have it working now ![]()
Thanks for the assistance everyone…working fine…
Ronnie
I have now got my latest set of graphs ready for public viewing. I have setup three sets to look at
First set using metric + MPH and my own data
Second set using US measurements and a US website’s data
Third set using US measurements and another US website’s data
These graphs have more user customisable information, you can choose the plot line colours as well as all the units. They will attempt to handle negative values correctly in all temperature related graphs and should set the y-axis scale accordingly. These graphs are currently running on PHP4 and JPGraph 1.20.5, they have also been tested OK on PHP v5 and JPGraph 2.3.
Please let me know what you think. If all looks OK then I’ll plan to get a package ready for downloading in a day or so.
Stuart
Wow, I know how much work it is to put together a set like that. A couple of comments based on the first graph of the first US set. Mixed resolution of the displayed values causes confusion. The vertical scale, 0, 0.01, 0.01, 0.02, 0.02 appears confusing because the legend resolution doesn’t match the scale increments, and then the single dp value on top of the column is 0.0, apparently not matching the graph.
Niko I missed that. The problem is with rain in inches and the number of ticks on the y-axis. Apparent;y its possible to get values like 0.252in of rain, now I mistakenly assumed that since most if not all rain guages had a resolution of 0.01in like my Davis I would always see values of multiples of 0.01in - not true. The issue with the y-axis labels can be sorted by having only very other one, but usually when there is more than a small amount of rain you need each tick labelled. This needs some more thinking about and maybe some more php code in the graphs themselves. The amount labels on the column tops were missing because I’d left out a line in some of the graphs - oops.
Stuart
I think you see those extra dp’s because the inch data is stored in mm by WD and that introduces some small errors when converted back to inches for display.
Yes you are correct, I’d just looked at the code. I round the result to 2 decimal places at least that’s what is coded but its not working as I expected… Need to get some ZZZZZZ’s now I’ll look again in the morning.
Stuart
Right guys time to try again. Fixed the problems noted by Niko and another couple I noticed myself.
First set using metric + MPH and my own data
Second set using US measurements and a US website’s data
Third set using US measurements and another US website’s data
Let me know what you think…
Stuart
They look very very nice Stuart. An awful lot of hard work there! You will save many of us a lot of hours trying to figure that all out.
Thanks. - Jim
The wind unit in the US set is wrong (KPH). Also shouldn’t KPH be km/h ?
Yes fixing that was easy, I forgot to change it in the config file after my testing earlier. Its a one character change in one file and all the graphs are correct.
Stuart
Bit more trivia. I think mm is more customary for millimeter and I’m not sure what’s correct for millibar, but MB looks like megabyte ![]()
Hi!
Looking great!
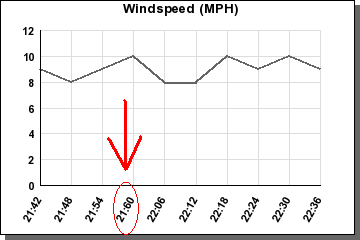
Just a note what I running over when viewing the metric set, there was a time as 21.60 as in image I attached. ![]()
Henkka
Again this is all user customisable in the config file, if we can come to a conclusion about what is correct I can set it up as default when I create the package.
I intend to distribute it with probably 3 or 4 config files which the user can rename to the default name and get a config file already set up with USA, UK or Metric settings already there, I’ll probably add one for Knots as well just for Brian and others in the sailing fraternity. As you will have noticed already its easy to forget one item.
Henkka I’ll fix that 21.60 as well.
Stuart
OK guys time to try again. I hope things are sorted, fixed another couple of bugs including one I spotted!
BTW It seems that most of the units of measurement should be lower case AFAIK, so mph mb in mm but hPa needs a capital P. Anyway as I said all of the units are customisable in the config file.
First set using metric + MPH and my own data
Second set using US measurements and a US website’s data
Third set using US measurements and another US website’s data
Once again let me know what I’ve not spotted ![]()
![]()
Stuart
Hi Stuart
My 24hr rain graph seems to be stuck any ideas??
Regards
Steve
Steve you need to check the values in the clientraw files to see what is in there as the graph simply displays these values, you can look in the graph php file to see which file and what offset is being used and use Kevin’s clientraw parser to see what is in there. I’ve noticed that these values dont reset when I expect it, perhaps we need to ask Brian when it should reset.
Stuart
Hi Stuart
Looks like it is back to normal!! threatening to get “Brian” on to it did the trick… ![]()
![]()
Steve
Stuart
Is the 12 months rain correct for the two US versions? Just seems odd that they would both have 10.6 inches in August, and also that August would be by far the max rain month.
Niko,
I’m pretty sure that the first US site is mine and when I check August with my handy dandy new Wunderground History script, it said 10.6 inches. Blew my sox off that it matched perfectly.