Hi! I am a geography student at the University of Hull and I’m hoping to collect some wind speed readings from across the UK to use as data in my dissertation. The information I need is from people who own private domestic weather stations that are attached to the roof of their houses or something similar. Please could you fill out the few questions below if you fit this description:
What was the annual average wind speed you recorded for 2006?
If possible, what were the quarterly wind speed averages for 2006?
Jan-Mar: Jul-Sept:
Apr-Jun: Oct-Dec:
What is the location of your weather station? E.g. an OS grid reference or an address with which I can find a grid reference myself.
Where is your weather station positioned? E.g. house roof.
Roughly how far off the ground is your weather station positioned?
Are there any surroundings that may affect the wind speeds your weather station records? E.g. trees, buildings, etc.
I will really appreciate any information that can be offered and anyone who has any advice that may help me it would be fantastic to hear!
Thank you very much!
Trish Hall Xxx
P.S. For anyone who’s interested I will be using this information in my dissertation to give accurate measurements of the power available to be produced by a range of domestic private wind turbines (such as the one on sale at B&Q) which I will then use to calculate the cost effectiveness of such a device and how this differs across the country.
The anemometer is mounted on a pole fixed to the rear wall of the house and is about 5 feet above the peak of the roof.
Approx 30ft above ground level at the front of the house (where the prevailing wind comes from) or 36ft above the ground to the rear of the house.
Not a lot. The anemometer is hogher than anything within 100ft of it and has a good view to the W and SW which is where the prevailing winds come from.
It will be interesting to hear your findings. I couldn’t find a wind speed/power output curve for the B&Q turbine, but based on a linear increase of power out to windspeed I seem to remember calculating that I’d have a 15-20 year payback period. That is unfortunate as the turbines are only expected to last for about 10 years! I’m left with the feeling that the turbines are intended to make you feel green rather than doing much for the environment.
Finally, don’t forget that there is a minimum speed below which the turbine won’t generate anything and a maximum speed at which it stops working (28mph?) We had winds here of over 28mph last year, so they will increase the average speeds a little, although probably not by a huge amount.
:oops: :oops: :oops: I’ve just spent 10 mins trying to find out how/where to do last years wind/energy and have come to naught…agggghhh…mutter mutter…HELP!!!..PRECISELY how can I do it? starting with “WD… (control panel maybe, or View…etc etc”)… :oops: :oops: :oops:…( no doubt #-o#-o will follow)…
:oops: :oops: #-o#-oEDIT: The instant I posted it I found it…WD/View/Logs (Wind energy)Right Hand side of panel/then as Brian says above…mmmm (but my data doesn’t cover the whole of 06 anyway)…#-o#-o#-o#-o :oops: :oops: :oops:
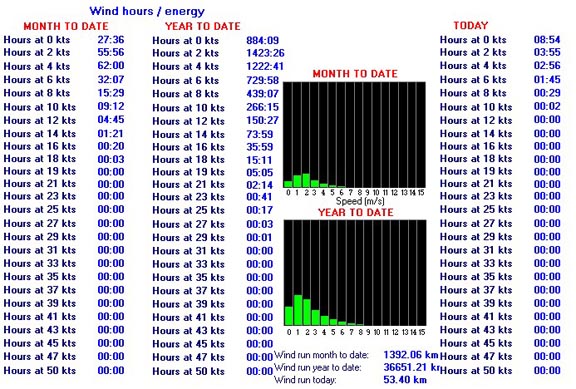
That shows some strange info. The hours for the year only add up to just over 4000 instead of 8760. Now I know I’ll have had a few outages, but nothing like 6 months worth!
Also the hours for each speed range are… 372/434/786/350/99/898/576/… I’m puzzled why the 9mph value is so low compared to those either side of it.
Finally, the month to date speed ranges go 0/2/4/7/8/11 and the other two ranges go 0/2/4/7/9/11. I assume the ‘8’ in the month to date column should be a ‘9’?
There’s definitely something wrong with the annual numbers. The hours at 8mph for November was 118:18 but the total at 9mph for the year is only 99:19.
when using those load buttons, WD calculates the hours from the data files (i.e adding up each minute of logged data and so adding hours at each speed)
compared to the first values you see when you go to that screen, which is from stored accumulating values
i will check on my routines though
What was the annual average wind speed you recorded for 2006?
1.4 mph
If possible, what were the quarterly wind speed averages for 2006?
Jan-Mar: No Data
Apr-Jun: 1.5 mph
Jul-Sept: 1.4 mph
Oct-Dec: 2.1 mph
What is the location of your weather station? E.g. an OS grid reference or an address with which I can find a grid reference myself.
Ottery st Mary - SY 096 951
Where is your weather station positioned? E.g. house roof.
Mounted on a mast, in the Garden
Roughly how far off the ground is your weather station positioned?
4m
6. Are there any surroundings that may affect the wind speeds your weather station records? E.g. trees, buildings, etc.
Is level with the house roof, with a small amount of turbulence evident, although stats checked with local METAR for accuracy.
We thought about getting a turbine, but with our wind figures, I don’t think we will bother !!! Suppose this is what happens when you live in the bottom of a valley …
I hadn’t looked at the renewable energy site for a while, so thanks for the pointer.
The ‘official’ estimates for wind speed @ 10m in my area are 5.7m/s (12.5mph) compared to my average for 2006 of 6.5mph at about that height. My house is actually pretty well sited for wind compared to many in this area, so I think the official estimate sounds too high.
So anyone round here buying a turbine based on the official figures is going to be very disappointed. If I assumed little turbulence then the best I can hope for is to generate 189kwh/year (and possibly as little as 63kwh/yer). Assuming the higher figure, I’ll save about
thanks for all the extra info guys, everythings been really useful and given me lots to look at!
for my disseration its important that iv got as many answers to the few questions iv asked above so any extra info is great but its also very important that i get some data together from those questions!
its great to hear all your views and ideas on this subject too! thanks!
Chris in the above posting you said “The ‘official’ estimates for wind speed @ 10m in my area are 5.7m/s (12.5mph) compared to my average for 2006 of 6.5mph at about that height.” Can I ask where you obtained that from and where I too might find similar info?
[quote author=administrator link=topic=25981.msg204303#msg204303 date=1186780324]
I hadn’t looked at the renewable energy site for a while, so thanks for the pointer.
The ‘official’ estimates for wind speed @ 10m in my area are 5.7m/s (12.5mph) compared to my average for 2006 of 6.5mph at about that height. My house is actually pretty well sited for wind compared to many in this area, so I think the official estimate sounds too high.
So anyone round here buying a turbine based on the official figures is going to be very disappointed. If I assumed little turbulence then the best I can hope for is to generate 189kwh/year (and possibly as little as 63kwh/yer). Assuming the higher figure, I’ll save about
I’d be very careful about using acerage speeds to calculate the power available from a wind turbine. I’m sure you’re aware of this, but the power of the wind is approximately proportional to wind speed cubed (AFAIK). Therefore simply using average windspeed will seriously underestimate the available power. Let me give an example:
Let’s say location A has an absolutely constant windspeed of 3 m/s. It will therefore be able to generate wind power of a constant times 3 cubed, or 27k.
Location B has an average wind speed of 3 m/s, the same as A, but half the time it’s actually 5 m/s, and the other half it’s 1 m/s. The power will then be 5 cubed times k divided by 2 (it’s only at 5 m/s half the time) plus 1 cubed times k/2 = 63k - about twice that of location A. So average is almost irrelevant - it’s the distribution of windspeeds that are important.
You’re assuming that the raw speed is being used for the calculation, but Trish hasn’t said how she will use the numbers. You can use calculations like http://www.reuk.co.uk/Calculate-kWh-Generated-by-Wind-Turbine.htm using a standard Weibull shape parameter of 2 for all locations (which is probably a reasonable guess for northern EU).
For a B&Q turbine at my location under ideal conditions (shape factor 1), I could expect to generate 699kwh/year or a saving of
Trish,
I am not within the panel but I would be very interested in reading your dissertation.
As was saying Admin I am not convinced a wind turbine will produce enough energy to pay itself in northern Europe.
So please be kind to publish on the forum when you are done.
By the way what about the solar cells or even the solar heater?