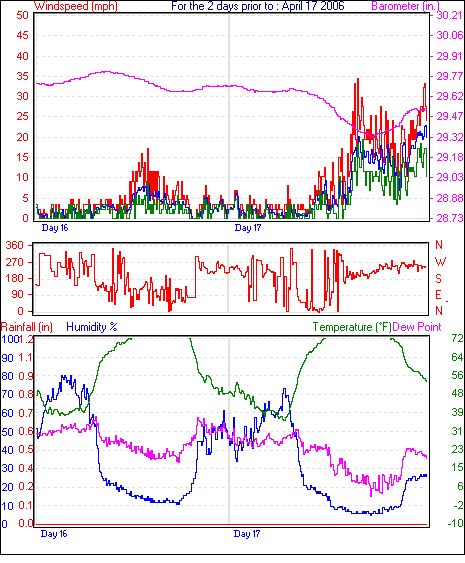
Is anyone else seeing clipping of the top of the temp curves on the graphs? Is there any way to rescale the temperature range so that it covers a wider range that won’t clip? Is this a bug?
See for example:
Is anyone else seeing clipping of the top of the temp curves on the graphs? Is there any way to rescale the temperature range so that it covers a wider range that won’t clip? Is this a bug?
See for example:
from the View menu, select graph history. At the bottom right of the screen you’ll find several buttons for scale fine tune for temperature, etc - adjust up or down as necessary.
Thanks. That helps, but doesn’t completely solve the problem.
Would I have to keep manually changing this as summer approaches, to make sure it doesn’t continue to clip?
Also, it didn’t seem to make any change on the Last 24/48/72 Hour graphs.
The problem is we go from very low dew points (desert-like climate) that can be -10 to -20 F and have highs in the 80s or 90s the same day. There must be some auto-scaling that should take this into account? Does manually adjusting the setting cancel the auto-scaling?
In “setup>graph setup” did you at some point set a value for the “max temperature on scale?” and tick the box?? You probably need to untick that box or change the value you have set.
Once a maximum value is set the graph will not auto scale upwards. The maximum scale function is generally intended for those who live in cool climates where temperatures will never get up to the graph default setting. But some tend to manually set their graph maximum lower for winter and reset them to default again in the summer.
Regards.
M
I have the same climate as you - just a bit lower in altitude and a few hundred miles to the east. I find I need to “kick start” the auto adjustment usually twice a year - mid spring, late fall. The daily temperature range is a bit more broad than most places it seems.
in setup, graph setup (or now control panel, graph setup), you can set the maximum value and tick, use…
WD does auto scale,but it obviously is not perfect…
WD does auto scale,but it obviously is not perfect....
I’m sorry - didn’t mean to imply that at all! I, like David, have some extreme swings in temperature over a 12 hour timespan this time of year the auto scaling would have to work overtime to keep up with 'em. So, sometimes I’ll manually adjust up or down 5 or 10 deg (then undo that within a day when the weather pattern changes again).
It’s not a problem with the auto scaling at all - just a very strange climate!
what i mean was i should be able to improve it./.
next time you get a big temperature swing, zip and email me your datafiles month42006.inf and latest.inf ![]()
I can do that. And wouldn’t you know - it’s NORMAL here today! #-o
Likewise, the temp is not as extreme here today, I don’t know if that is “normal” or “abnormal”.
Anyway, thanks for the help. I found the settings (they were not ticked), so I set them manually for now. I had a 50 degree (F) swing on April 10th with a delta of about 85 degrees between current temps and current dewpoints. April 11th was nearly as wide a range. I don’t know if the older data is helpful?
-David