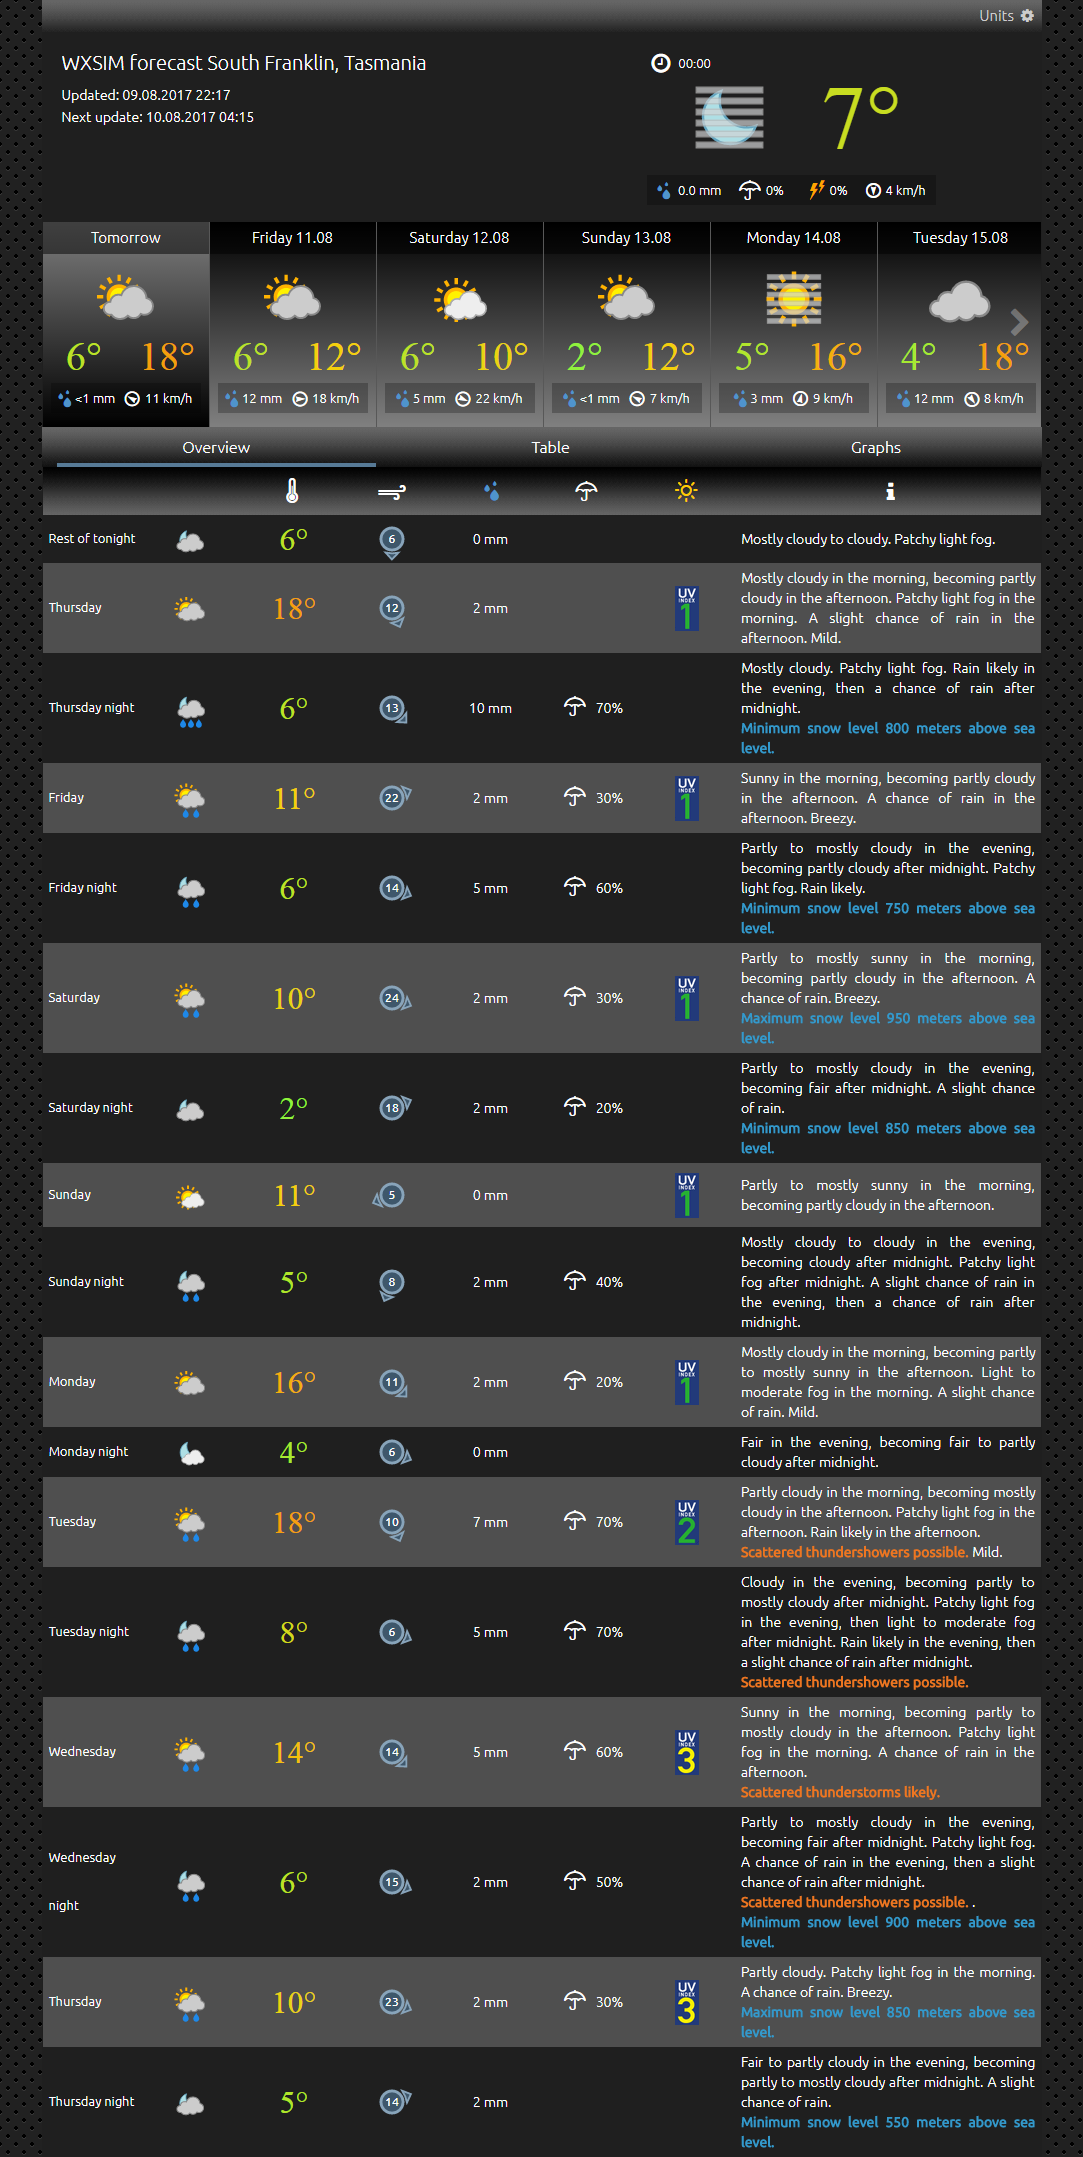
Thanks, Henkka! Finally it’s working. I have a test site here: http://runarweb.com/forecast_test.php It was the path that was the problem. You were right that I needed an absolute path for $path_to_lastret and $path_to_langfiles. They are now:
$path_to_langfiles = “/customers/0/a/0/runarweb.com/httpd.www/wxsim_ewn/wxsim/”;
$path_to_lastret = “/customers/0/a/0/runarweb.com/httpd.www/wxsim_ewn/wxsim/lastret.txt”;
After looking at it looks great. But I have some comments and questions:
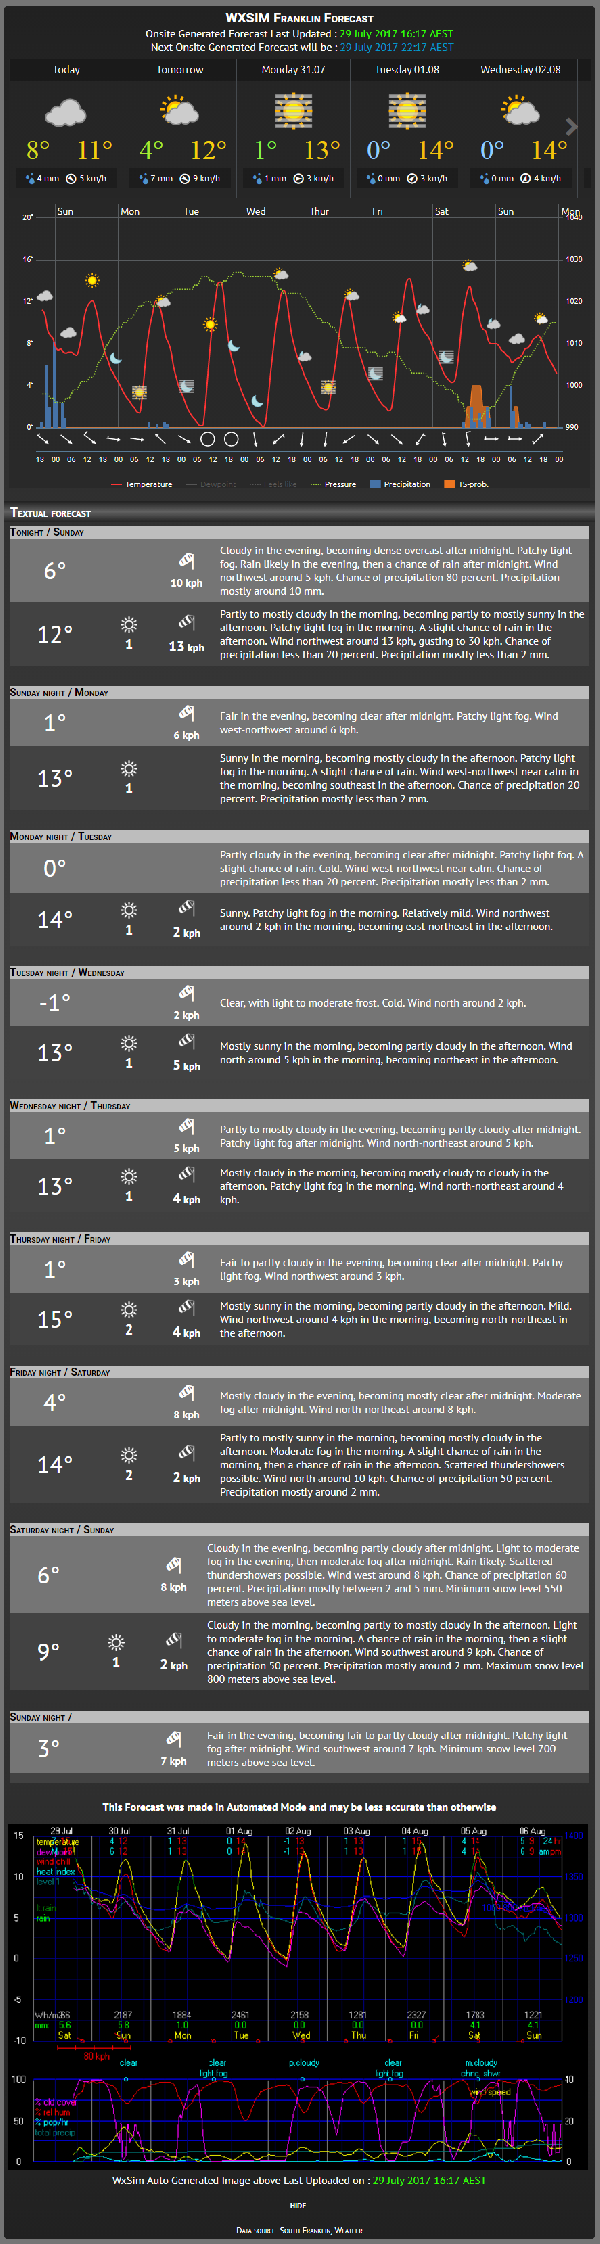
- In the Graphs section it’s difficult to see the precipitation amount when it rains several hours. The numbers overlap. Also there is no Y-axis for precipitation. Have you done any thinking about that?
- Would it be possible to have the days at the X-axis, not only the time? It would make it easier to get an overview of each day.
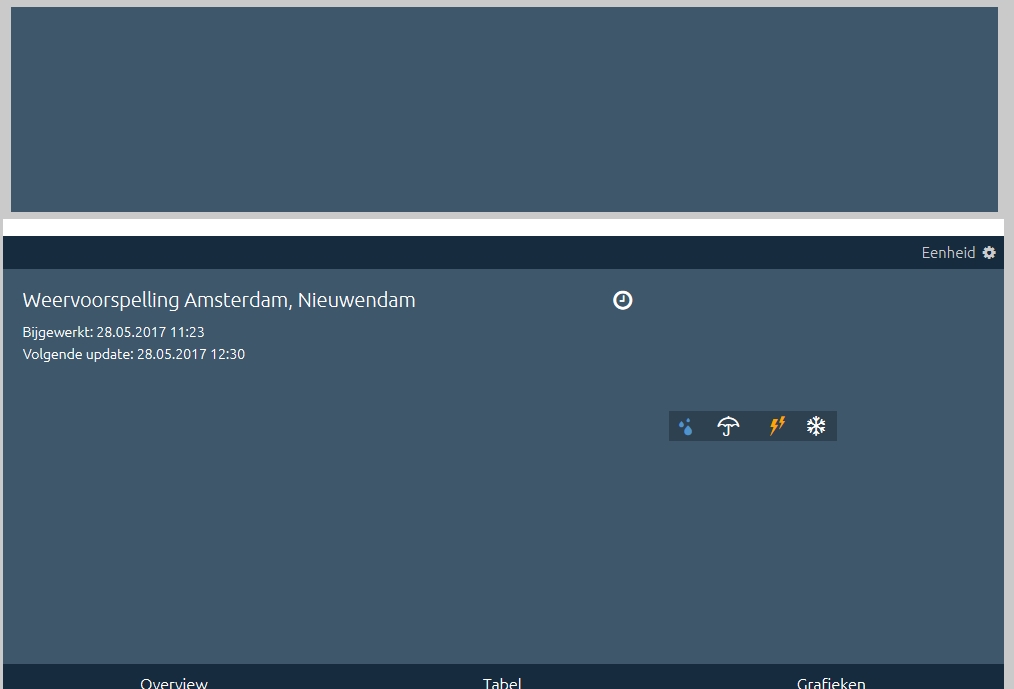
- I don’t quite get how the buttons on the bottom of the graps work? When I enter Graphs, Forecastgraph is marked and the graph is shown. Pressing Show whole forecastperiod shows that graph, but now both buttons are marked. Pressing Forecastgraph now nothing happens. Pressing Show whole forecastperiod switches between the 2 graph each second time.
- Legends for Dewpoint and Feels Like are greyed out. Do you plan to show them?
- Do you mean this to be a replacement for the 3-in-1 script? I don’t see 3-in-1 on your site anymore.


