Tom I noticed that when I run the daily analysis in WXSimlite I get the " Residual error in maximum is suspiciously large, possibly due to missing or insufficient station data" at the bottom of the screen. Now as far as I can tell there is no missing data in my log files so I dont understand why I am seeing this. I have not seen any other error messages anywhere in any part of Lite or WXSim etc.
Stuart
Tom I am still seeing this error message on every run of Lite’s analysis. I’d really like to understand what is causing this, can you explain the logic please?
Stuart
Hi Stuart,
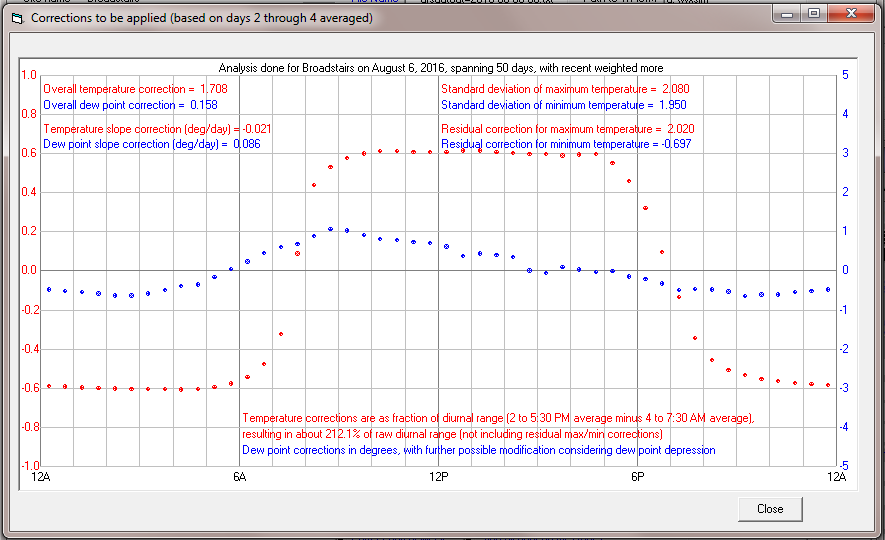
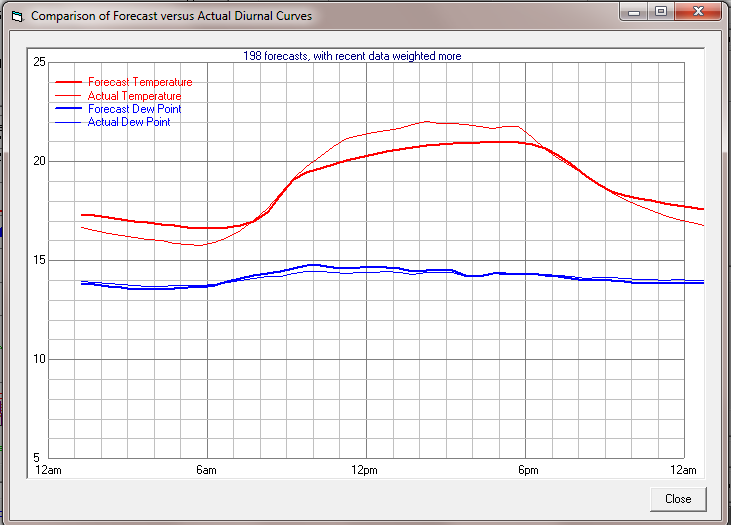
It is a little surprising, but not necessarily a bad thing (depends on how far out of the expected range it is). Could you send me cormod0.txt? Also, after the next analysis, try clicking each of the three “Show …” buttons and post screen shots of the graphs that appear.
I think it’s an artifact of your coastal location and fluctuations in temperature resulting from your sea breeze, but I’m not sure. I might be able to tell from those files and screenshots.
Thanks,
Tom
Tom for some reason I missed your reply. I’ll gather the data reply later.
Stuart
Tom here are the graphs and file you wanted…
Stuart
cormod0.txt (997 Bytes)
Hi Stuart,
I actually think I understand what’s going on! I’m less certain about what advice to give …
WXSIM-Lite is trying to modify raw GFS forecasts for your location, but those raw forecasts are rather bad, as it seems GFS is modeling a more maritime point, like a few miles out to sea. This is entirely plausible, given the .25 degree resolution. The diurnal range it’s expecting is quite small, and WXSIM-Lite is struggling to increase it (and is doing almost enough), but giving out warnings.
What percent usage are you running for WXSIM-Lite? Also, can you post correc.txt? I’m trying to decide whether or not you’re one of those users (the large majority) who benefits from using WXSIM-Lite, or if maybe you’d be better off without it (or using it at a lower mix percentage). I think it can be tricky for coastlines and islands, because of that resolution issue.
Tom
Tom I’m using 65% as the percentage currently and attached is correc.txt.
Just some thoughts on my location, if you draw a circle 20 mile radius on my location on a map centred on Broadstairs probably 75% of that area would be sea hence I believe that is why we have somewhat of a micro climate here, it is often warmer here in winter with fewer frosts and cooler in summer than maybe only a few miles inland, also bear in mind my exact location is probably no more than 800 yards from the waters edge as the crow flies and we are about 130 metres up as we have chalk cliffs here (although not quite like The White Cliffs of Dover  ).
).
Stuart
correc.txt (48.6 KB)
A couple toughts re coastal locations from a WXSIM-user who also lives near coast…
-
How about taking (weighted) average of 2 closest points of GFS instead of just the closest one in this kind of tricky locations?
-
Another could be to look up the points and choose the point(s) what best fits the location (not probably the closest one)
-
As last, there are 13 km (0.125
Hi Henkka,
The current algorithms in both the McMahon and Bohler routines use a planar interpolation (therefore weighted averaging in two dimensions) to get the exact point. For the Bohler data, we’ve experimented with the 0.25 degree output, which I think might help some in such cases. The resulting files were correspondingly four times as big, with correspondingly longer processing times, so we were still using the 0.5 for speed and reliability. I am now thinking we may upgrade to the finer grid. By the way, it’s the same model, with the same inherent resolution; it’s just a matter of how much data is listed in the GRIB files. Usually, this is a pretty trivial difference, but in might matter right on a coast. I’ll check with Sam about our server capacity and processing speed issue for our data.
Thanks!
Tom
Tom I’m just wondering if you have any more thoughts on these messages and why I see them?
Stuart