After upgrading to the latest version of the WxSIM 3in1 Forecast script, I noticed several items that didn’t appear “tailor-able”. After digging through portions of the script, I believe I’ve found where making slight changes to the code has made the output more like I wanted. I thought I’d share my findings if you’re interested.
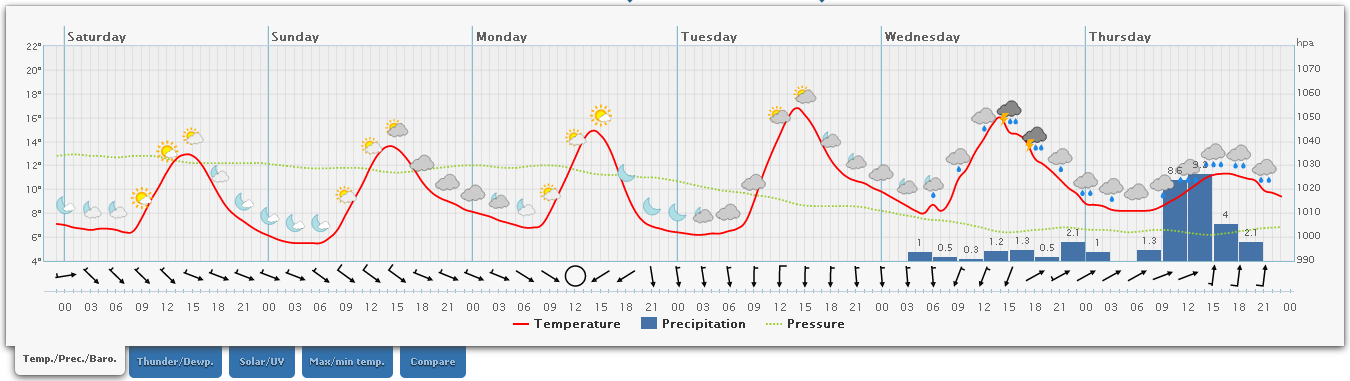
The first item I noticed was that forecast graph showed only 3 days. I found where the number of hours displayed on the graph is set in wxall.lastret.php on line 414. The current value of 74 represents 74 hours (slightly more than 3 days). If you want a longer timeframe shown, simply change 74 to a value of your liking.
The next items apply to those using Farenheit degrees and inches of barometric pressure.
2) On the right side of the forecast graph where the barometric pressure is shown, it appears “hpa” is hard-coded even though the units used is inches. This can be changed by going into the wxsim.js file and changing "hpa’ to “in” on lines 124 and 148.
3) In this same portion of the graph, the range shown for barometric pressure is not only excessive, but the values are impossible to reach. To have a much more reasonable range, go into the wxsim.js file to line 137 and change the value for allowDecimals to “true”.
The final items have to do with the Compare tab. This graph compares WxSim forecasts to YR.NO forecasts. Unfortunately, my WxSim forecasts are shown in Farenheit and the YR.NO forecasts are shown in Celsius, making the comparison pretty useless. So far, I’ve not been able to find a way to get the YR.NO forecast in Farenheit, so I’ve chosen to just turn off the Compare function. Here’s what I did.
4) In wxall.lastret.php on line 660, I simply deleted this entire line. This removes the Compare tab from the graph.
5) I determined that wxall.lastret.php reads the YR.NO data from a cache file if it is recent, otherwise, it gets the latest data from YR.NO. The default refresh period for the cache file is 1 hour (3600 seconds) that is set in line 790 of wxall.lastret.php. Since I have no need for the YR.NO data being current, I’ve set the value for $fetchSeconds to be 604800. That way the cache isn’t getting updated but once a week since it’s not used at all. I’m sure I could have completely disabled getting any data from YR.NO, but I was trying to modify only values instead of changing code if possible.
Thanks for the heads up about these issues, Steve.
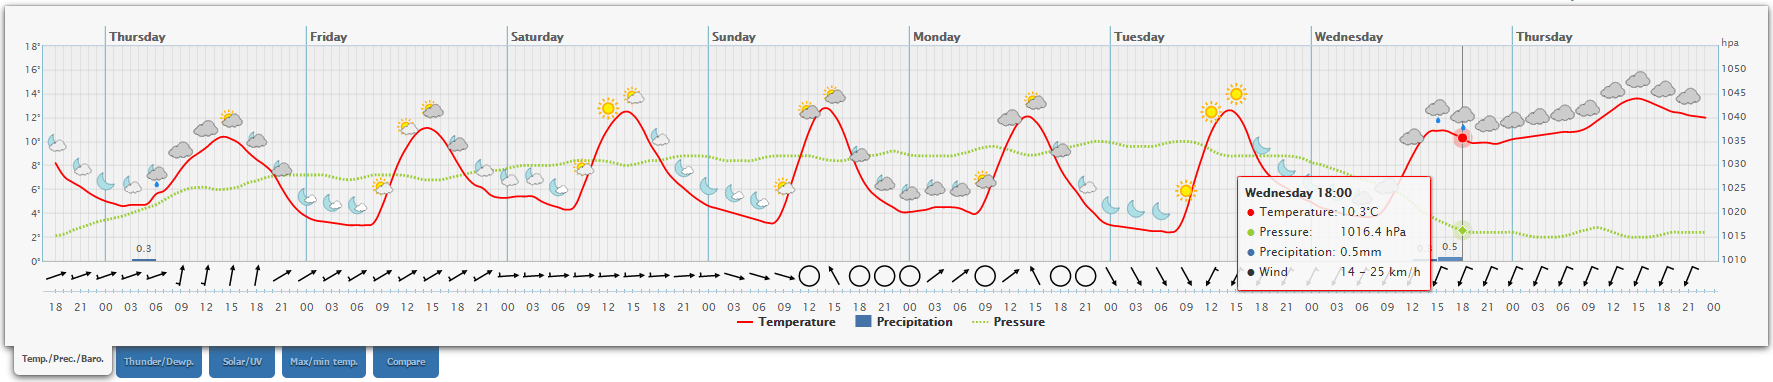
I’ve been able to display up to 144 hours, but no more by modifying wxall.lastret.php’s $hr1<xxx parameter. There is another instance of $hr1<72 which I also changed to $hr1<144.
The other mods are very useful and sorely needed because of the absence of some optional units configuration and a marginally helpful barometric range.
Thanks to you my Compare tab is gone, and I’ve set the cache to refresh after 2592000 seconds, 30 days, since it isn’t used.
Have you noticed that when you scroll over the precip it goes from 0 to whatever the amount is, it keeps showng the 0
amount, it does it on all that i have seen
Yes been all over that, not found a fix yet. At least it ends after the 3 hr Bar period showing the Precip Correctly for the previous 3 hr period.
Off to bed now too late - may look at it over weekend, would really prefer to push the Latest.csv or Lastret.txt into MySql and run the Highcharts via views / queries same as I do with other site data including Soil and Temp Compare data.
Had a few goes at it but failed each time, will keep trying.
My website http://bestpalm.pl/pogoda/wxnewpage.php
J have read this post and try to see precipitation on my graph but still no raining on the graph, enclosed my wxall.lastret.php. What can be wrong?
In the 3in1 package there should be a graphic image of wret settings - looks like you have not checked all boxes correctly in wret.exe
The Precipitation you see on your “overview” page below the meteogram is obtained from the “Plaintext.txt” file that’s ok and working, but the meteogram and other hour by hour pages etc obtain data from the “lastret.txt” file which in your case is missing PTOT “Precipitation Total” because you obviously do not have it checked in Wret.exe