I really like the CurrentCost add-on in WD but I have noticed a problem on the graph.
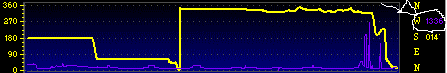
See attached annotated screenshot; the CurrentCost (channel-1) graph label does not update with the current power consumption - it only displays the correct power if the cursor is active on the graph.
WD 10.37Qb41 + CurrentCost EnviR.
set to show the separate current cost data
then make your WD screen wider (after setting to allow main screen customisation)
note that is not a bug that you are describing, but a lack of a feature
Excellent thanks, I like the added pane for CurrentCost data.
The only adverse effect of resizing the window horizontally is that the VP ticker has also moved in proportion to the resize i.e. to the right halfway over the graphs #-o
Brian,
I have a customised main screen, i want to see what the data is on teh graph plots, i have it enabled to do so in the new option, but i don’t see it.
Is there a X/Y axis in a setup file somewhere, where i can go in and edit the co-orinates to somewhere i know is free for me to move it too, i am assuming the current position is covered up by something.
you can modify the position of the scrolling window Bassstudio, via the main screen customisation
yes, stuart, set to save your main screen settings
then you will see the settings for the x/y for the current cost (groupboxcurrentcost)
ok, thanks Brian,
here is my screen should anyone wanna see it with the current cost data in there.
The picture is huge so i have posted it as a link. (my screen is 1920x1200).
http://www.newchurchweather.co.uk/files/wdscreen.png
also, here is where Brian has put the current cost data by default (i have opened up the screen a bit as it would normally be off screen). This was taken on another PC with smaller screen, so picture is smaller than above.
http://www.newchurchweather.co.uk/files/wdccdefault.png
Looks like I need to get it to use the same font as selected for the rest of the screen data
Hey Stuart
I’m getting this errormessage when trying to see your page.
"The image
yeah, the hosting company are getting a bit annoying at the moment, i would say 3/4 of the time i want to load up a page, i get errors.
Keep refreshing, it will get there eventually. sorry for this.
for the font type, use a new .zip update, ready now
WD now has its own daily totals, kwh, from the real time kw data
and that is now shown in the separate currentcost data box area (make that wider to show that)
latest .zip update
nice addition there Brian, thank you for that!
Does WD record how much power in kw/h you use every day? So for example at 23:59 everyday, that figure is taken and stored?
the total is reset at midnight, for each channel
but , no, its not logged or stored
for me I can now see which wind turbine is producing more power, and compare to solar, etc
I have added some new custom tags for this new data
so you could add it to a custom logfile…
%currentcostdailytotal1%…WD calculated daily history channel 1 (kwh)
%currentcostdailytotal2%…WD calculated daily history channel 2 (kwh)
%currentcostdailytotal3%…WD calculated daily history channel 3 (kwh)
ah nice one Brian, i will look into that the next time i update WD, will likely be early next week or when you next update your version history page (that’s when i usually update).
Thanks Brian. NOt played with custom log files before, so will learn something new there 
Current cost graphing.
After a few delays (A faulty transmitter) I have finally got 6 channels reporting and graphing. The graphs a bit rough yet as I sort out the circuits I want to monitor and the colour scheme etc
http://tokoroaweatherlive.net/housepowerv1.php
Some of the channels overlap each other as they are on the same circuits. I will have to do a bit of rewiring of the 20 year old power board to get the results I want and seperate out the various power plug and lighting circuits.